
Thanks for your feedback.
 Feedback?
Notifications in Control Hub is a central place to manage alerts for your Webex deployment. Administrators can configure alerts to be delivered through email, webhooks, PagerDuty, or in a Webex App space. Regardless of the delivery channel configured, all alerts will always appear in Control Hub.
Each administrator has their own set of alerts and rules that they can create and view in My alerts and My rules tabs, and they can view all alerts and rules from other administrators in the organization in the All alerts and All rules tabs.
Alerts for the last 14 days will appear in the Alerts section. You can export historical alerts for the last 30 days in a CSV format by clicking on the export button.
Alerts that occur on the same day and have the same severity, type, and target are grouped together in a collapsible drop-down menu to make them easier to view and navigate. You can hover over the expand button to see how the alerts were combined.
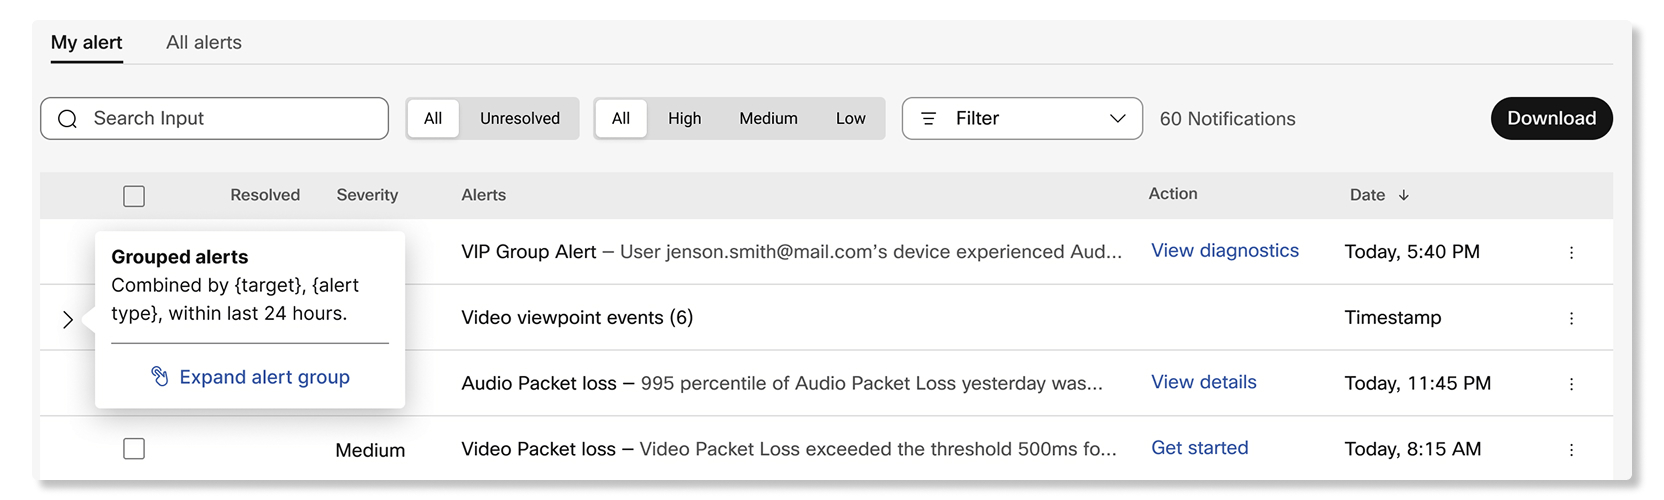
There are two categories of alerts: Threshold-based and Service-generated.
Threshold-based alerts
Administrators can create a rule to monitor for specific events by specifying specific thresholds, such as participants who reach more than 300ms of latency or a packet loss of more than 8%. These alerts are only triggered if the administrators configure them by creating a rule.
Administrators can further configure how these alerts are delivered by choosing the delivery channel for them:
- Email—You can add up to 30 email addresses as recipients to receive the alerts.
-
Webex App—You can receive the alert in a new space, an existing
space, or in a 1:1 space.
If an existing space gets renamed, the alert will still be delivered to the same space.
- Webhook—The alerts will be delivered to the webhook URL configured in Control Hub.
- PagerDuty—You can input a service key to deliver the alerts to a related service using PagerDuty.
Service-generated alerts
These alerts are created automatically by Webex services. Most of these alerts are critical in nature that the administrator should pay attention to. Administrators can manage how these alerts are delivered by choosing the delivery channel for them similar to threshold-based alerts. The delivery channels include email, Webex App, webhook, and PagerDuty.
View alerts and rules
| 1 |
Sign in to Control Hub and go to Notifications. |
| 2 |
Select one of the following:
|
Find alerts by target
Use the Target column to see which device, workspace, user, trunk, or other target an alert affects. Search by target name to find related alerts.
A target appears only when target information is available for the alert.
| 1 |
Sign in to Control Hub and go to . |
| 2 |
Select All alerts or My alerts. |
| 3 |
Check the Target column for the affected target. |
| 4 |
Enter a target name in the search field to find matching alerts. |
Understand an alert type
Read an explanation of an alert type in its side panel to learn what the alert means.
Descriptions aren't available for every alert type.
| 1 |
Sign in to Control Hub and go to . |
| 2 |
Select All alerts or My alerts, then open an alert. |
| 3 |
If an information icon appears beside Type, use it to read the explanation. |
For Webex Meetings, you can create rules to get alerts for:
- Live meeting monitoring—Use this alert to find out when participants are experiencing media quality issues during meetings that are in progress. You can create up to 10 of these alerts.
- Device live meeting monitoring—Use this alert to find out when devices are experiencing media quality issues during meetings that are in progress. You can create up to 25 of these alerts.
- Historical meeting quality trend—Use this alert to find out when a percentage of participants in specific Webex sites and locations reach the media quality thresholds that are set automatically based on the past performance of meetings within the last seven days. You can create up to 10 of these alerts.
- Historical meeting quality monitoring—Similar to the history meeting quality trend alert, you can use this alert to set your own thresholds on when to receive an alert when a percentage of participants in specific Webex sites and locations reach any of the media quality thresholds. You can create up to 10 of these alerts.
Meeting alerts only trigger for participants who attend meetings through Webex Meetings and Webex App. The minimum app versions that participants must use for alerts to trigger are:
-
Webex Meetings desktop app version 39.6.5 or higher
-
Webex Meetings mobile app for Android and iOS version 39.11 or higher
-
Webex App desktop version 3.0.12427.0 or higher
-
Webex App mobile Android version 4.1.6 or higher
-
Webex App mobile iOS version 4.3 or higher
Alerts don't trigger for audio-only meetings, Webex Events, and Webex Training sessions.
You can enable up to 10 live meeting monitoring alerts per organization. Each alert can monitor up to either 30 user email addresses or 30 devices.
If the Monitor all participants check box is checked, then the alert only triggers for meetings with fewer than 50 participants.
| 1 |
Sign in to Control Hub and go to Notifications > My rules. |
| 2 |
Click Create rule. |
| 3 |
Select Live meeting monitoring next to Type, and enter the name for the alert next to Title. |
| 4 |
Toggle the Status switch to on to receive notifications for the alert. |
| 5 |
Select User email(s) or Device name(s) and enter up to 30 user email addresses or devices. |
| 6 |
Check the Monitor all participants check box to receive alerts for all of the participants that are in the same meetings as the users or devices in the list. |
| 7 |
In the Rules section, set the following thresholds:
|
| 8 |
Set the Accumulated and Consecutive duration for the alert to trigger. |
| 9 |
In the Delivery channel section, check the Email check box and enter the email addresses of who will receive the alerts. |
| 10 |
Check the Webex space check box and enter the name of the space if you want to receive messages in that space whenever a threshold is reached. |
| 11 |
Click Save. |
You can enable up to 25 device live meeting monitoring alerts per organization.
| 1 |
Sign in to Control Hub and go to Notifications > My rules. |
| 2 |
Click Create rule. |
| 3 |
Select Device live meeting monitoring next to Type, and enter the name for the alert next to Title. |
| 4 |
Toggle the Enabled switch to on to receive notifications for the alert. |
| 5 |
Choose to monitor:
|
| 6 |
In the Rules section, set the following audio and video thresholds:
|
| 7 |
Set the Accumulated and Consecutive duration for the alert to trigger. |
| 8 |
In the Delivery channel section, you can:
|
| 9 |
Click Save. |
You can add up to 10 historical meeting quality trend alerts per organization.
| 1 |
Sign in to Control Hub and go to Notifications > My rules. |
| 2 |
Click Create rule. |
| 3 |
Select Historical meeting quality trend next to Type, and enter the name for the alert next to Title. |
| 4 |
Toggle the Status switch to on to receive notifications for the alert. |
| 5 |
Select which Webex site and participant locations to receive alerts for. |
| 6 |
In the Delivery channel section, check the Email check box and enter the email addresses of who will receive the alerts. |
| 7 |
Check the Webex space check box and enter the name of the space if you want to receive messages in that space whenever a threshold is reached. |
| 8 |
Click Save. |
You can enable up to 10 historical meeting quality monitoring alerts per organization.
| 1 |
Sign in to Control Hub and go to Notifications > My rules. |
| 2 |
Click Create rule. |
| 3 |
Select Historical meeting quality monitoring next to Type, and enter the name for the alert next to Title. |
| 4 |
Toggle the Status switch to on to receive notifications for the alert. |
| 5 |
Select which Webex site and participant locations to receive alerts for. |
| 6 |
In the Rules section, set the following thresholds:
|
| 7 |
In the Trigger section, select a duration to monitor and enter the percentage of participants that must reach one of the thresholds to trigger the alert. |
| 8 |
In the Delivery channel section, check the Email check box and enter the email addresses of who will receive the alerts. |
| 9 |
Check the Webex space check box and enter the name of the space if you want to receive messages in that space whenever a threshold is reached. |
| 10 |
Click Save. |
For Webex Calling, you can configure the following alerts:
Add a call quality drop alert
Use this alert to find out when the call quality at specific locations or a user's media session drops to poor quality.
Call quality is calculated as:
- Good—Both video and audio stream had jitter below 150ms, latency below 400ms, and packet loss below 5%.
- Poor—Both video and audio stream had jitter above 150ms, latency above 400ms, and packet loss above 5%.
Alerts are sent out when a call ends. When you receive the alert, you can click Troubleshoot Call to take you straight to the call in Troubleshooting if the alert is monitoring specific users. If the alert is monitoring locations, you can click View Analytics to take you to the Media Quality tab in Calling Analytics.
You can create up to 10 Call Quality Drop alerts per organization.
Alerts are not triggered on Dedicated Instance (DI) based trunks.
| 1 |
Sign in to Control Hub. |
| 2 |
Go to Notifications > My rules. |
| 3 |
Click Create rule. |
| 4 |
From the Service drop-down list, select Calling. 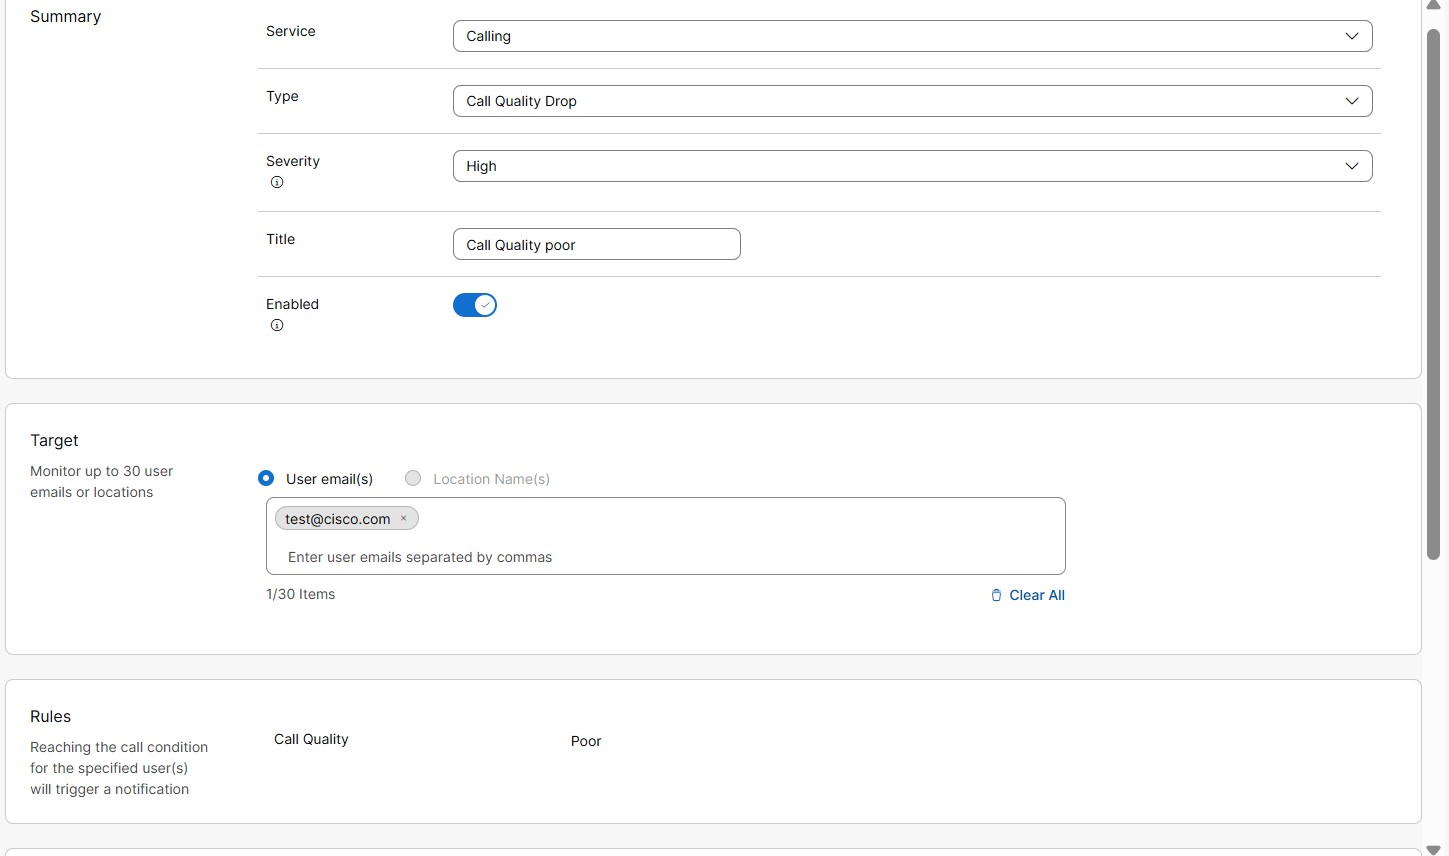
|
| 5 |
From the Type drop-down list, select Call Quality Drop. |
| 6 |
From the Severity drop-down list. This field shows how severe or important an alert is. You can choose severity level as
High, Medium, or Low.
|
| 7 |
Enter a Title. |
| 8 |
Toggle on Enabled to receive notifications for the alert. |
| 9 |
In Target section, select User email(s) or Location name(s). You can enter up to 30 user email addresses or locations to monitor.
|
| 10 |
In the Delivery channel section, choose how to receive the alerts: 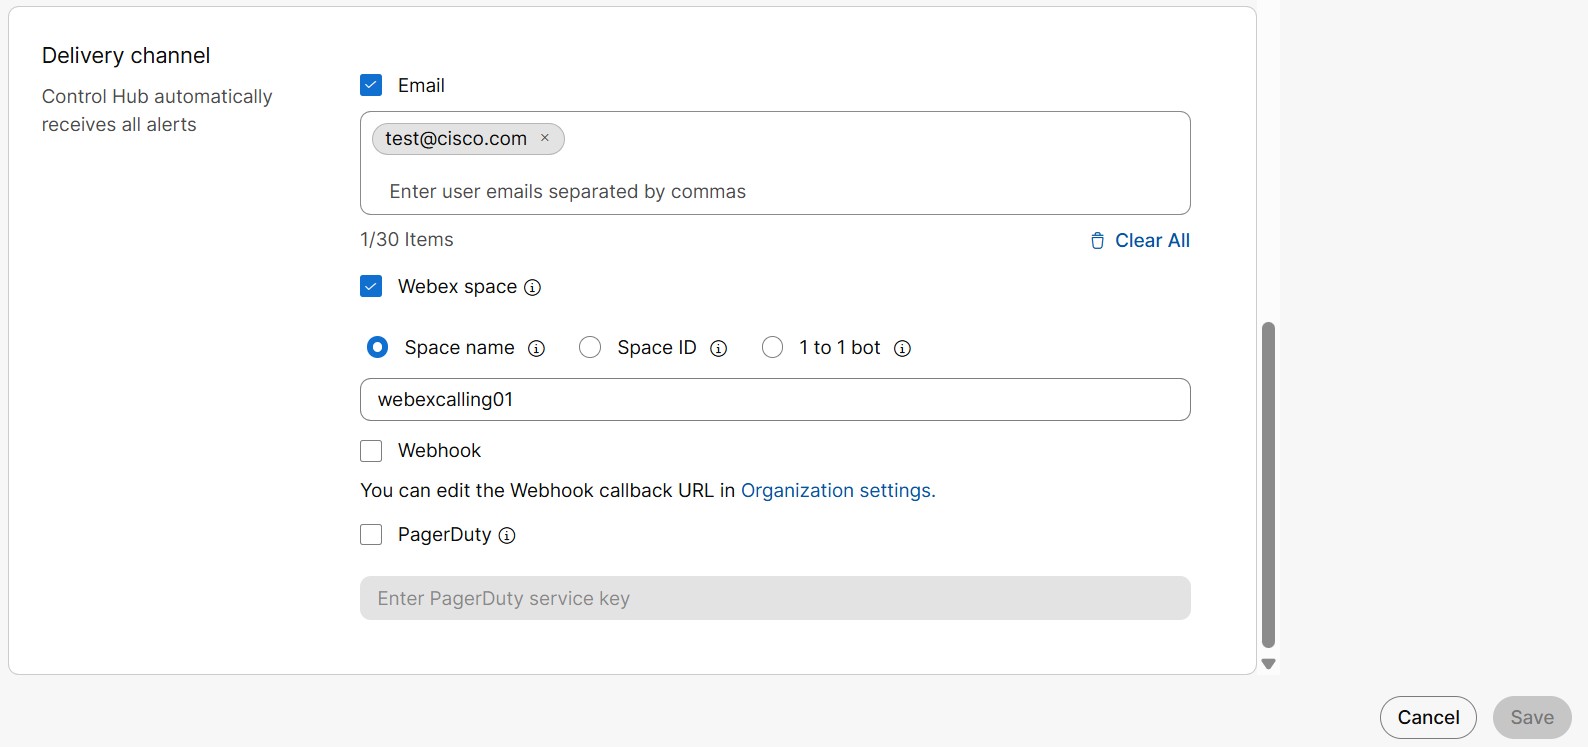
|
| 11 |
Click Save. |
Add a trunk status change alert
An alert is sent out when the status of the monitored trunk changes. The available trunk statuses are online, offline, and impaired. You can configure which status change should trigger an alert.
The following are the different trunk status:
-
Online—Successful registration of Local Gateway to Webex Calling.
-
Offline—Unsuccessful registration of Local Gateway to Webex Calling.
-
Impaired—Unsuccessful connection between at least one Webex Calling Edge proxy and Local Gateway.
-
Unknown—In the process of establishing a connection between Webex Calling and the Local Gateway that is recently added.
To know more about various status error changes, refer to help center article Local Gateway Troubleshooting section.
| 1 |
Sign in to Control Hub. |
| 2 |
Go to Notifications > My rules. |
| 3 |
Click Create rule. |
| 4 |
From the Service drop-down list, select Calling. 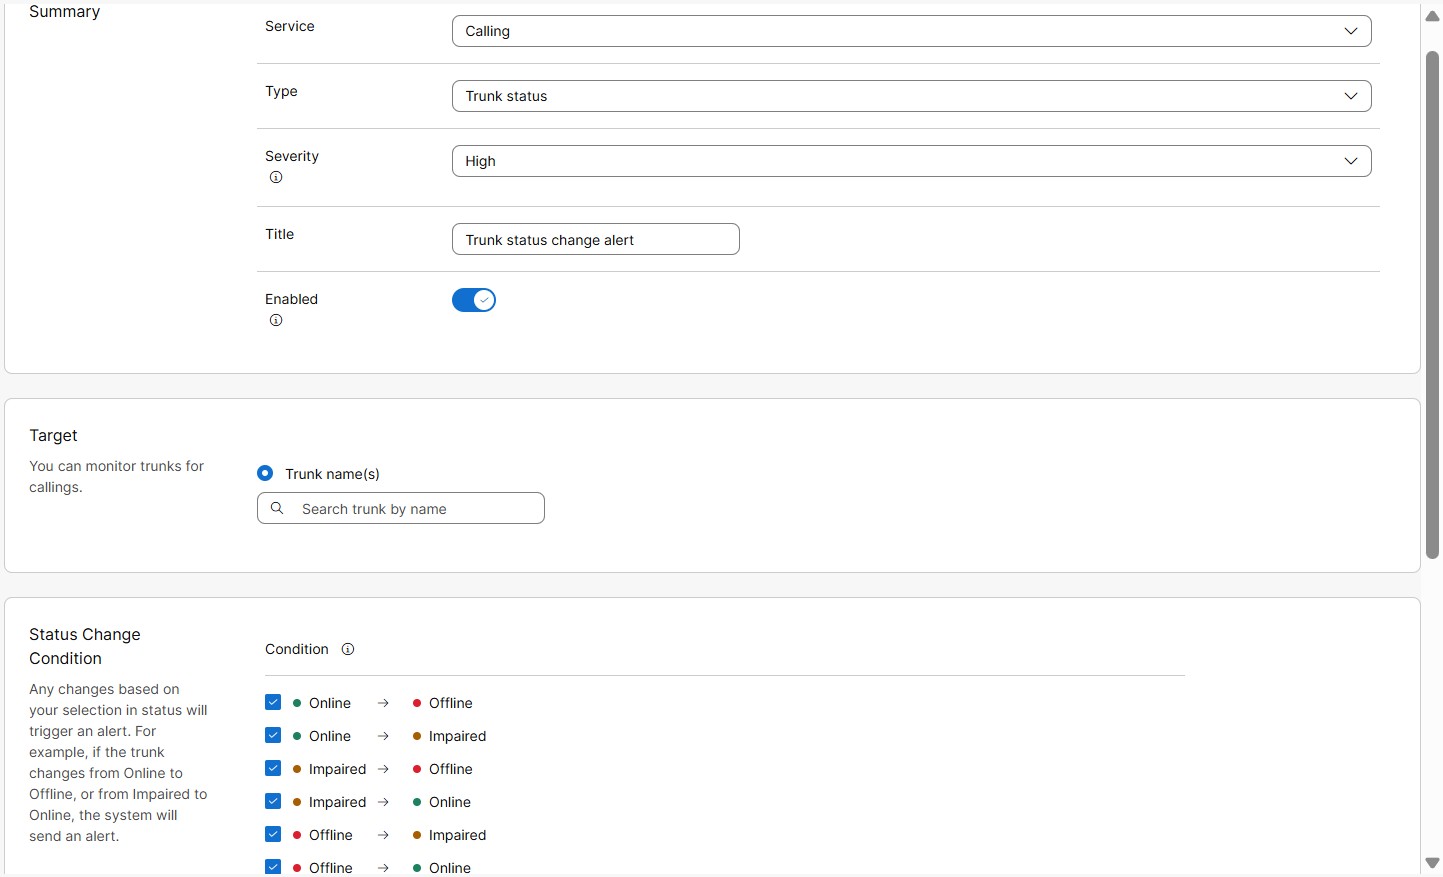
|
| 5 |
From the Type drop-down list, select Trunk status. |
| 6 |
From the Severity drop-down list. This field shows how severe or important an alert is. You can choose severity level as
High, Medium, or Low.
|
| 7 |
Enter a Title. |
| 8 |
Toggle on Enabled to receive notifications for the alert |
| 9 |
In Target section, select Trunk name(s). You can enter up to 30 trunks to monitor.
Alerts are not triggered on Dedicated Instance (DI) based trunks. |
| 10 |
In the Rule definition section, you can define the rule for when alert needs to be triggered. You can select all or choose from the following status changes:
|
| 11 |
In the Delivery channel section, choose how to receive the alerts:
|
| 12 |
Click Save. |
Add a trunk concurrent call limit alert
An alert is sent out when threshold limit of concurrent calls on trunk is reached. This alert helps to identify the busy hour or day when trunk capacity is reached to handle concurrent calls.
Consecutive alerts are triggered at the selected time interval, if the configured threshold continues to breach.
| 1 |
Sign in to Control Hub. |
| 2 |
Go to Notifications > My rules. |
| 3 |
Click Create rule. |
| 4 |
From the Service drop-down list, select Calling. 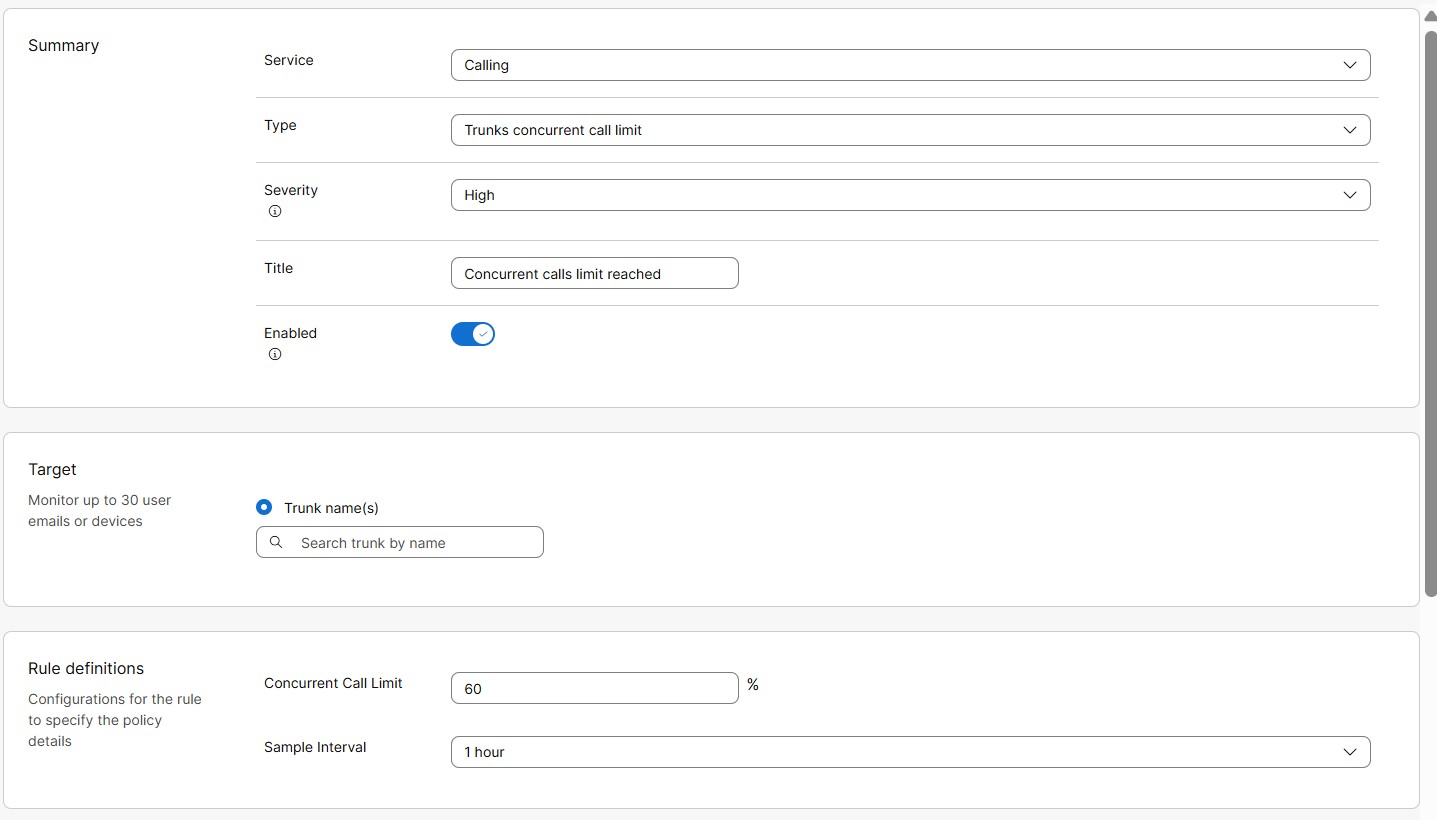
|
| 5 |
From the Type drop-down list, select Trunk concurrent call limit. |
| 6 |
From the Severity drop-down list. This field shows how severe or important an alert is. You can choose severity level as
High, Medium, or Low.
|
| 7 |
Enter a Title. |
| 8 |
Toggle on Enabled to receive notifications for the alert. |
| 9 |
In the Target section, select Trunk name(s). You can enter up to 30 trunks to monitor.
Alerts are not triggered on Dedicated Instance (DI) based trunks. |
| 10 |
In the Rule definitions section, you can define the rule for when alert needs to be triggered. Enter the following values for Concurrent call limit threshold condition: |
| 11 |
In the Delivery channel section, choose how to receive the alerts:
|
| 12 |
Click Save. |
Trunk certificate expiry alert
An alert is sent out when the certificate of a certificate-based trunk is about to expire or has expired. This is a system-generated alert, enabled by default for organizations with certificate-based trunks.
Before the certificate expires, automatic alerts are sent out on predefined days, such as on 60th day, 30th day, 15th day, and 7th day before expiry. After the certificate expires, an alert is sent out immediately and only once. No consecutive alerts are sent.
Alerts are not triggered on Dedicated Instance (DI) based trunks.
Route List calls blocked alert
When the number of concurrent calls exceeds the Route List Calls license limit, up to 20% additional capacity (bursting) is allowed. When the off-net (PSTN) call volume exceeds 20% bursting limits, they are blocked. An alert is sent to the user about Route List calls are blocked.
Before you begin
| 1 |
Sign in to Control Hub. |
| 2 |
Go to Notifications > All rules. List of all rules is displayed.
|
| 3 |
Select Route List Calls Blocked alert. Route List Calls Blocked alert is a system-generated alert. Therefore you can only edit few of its details as mentioned in next steps. 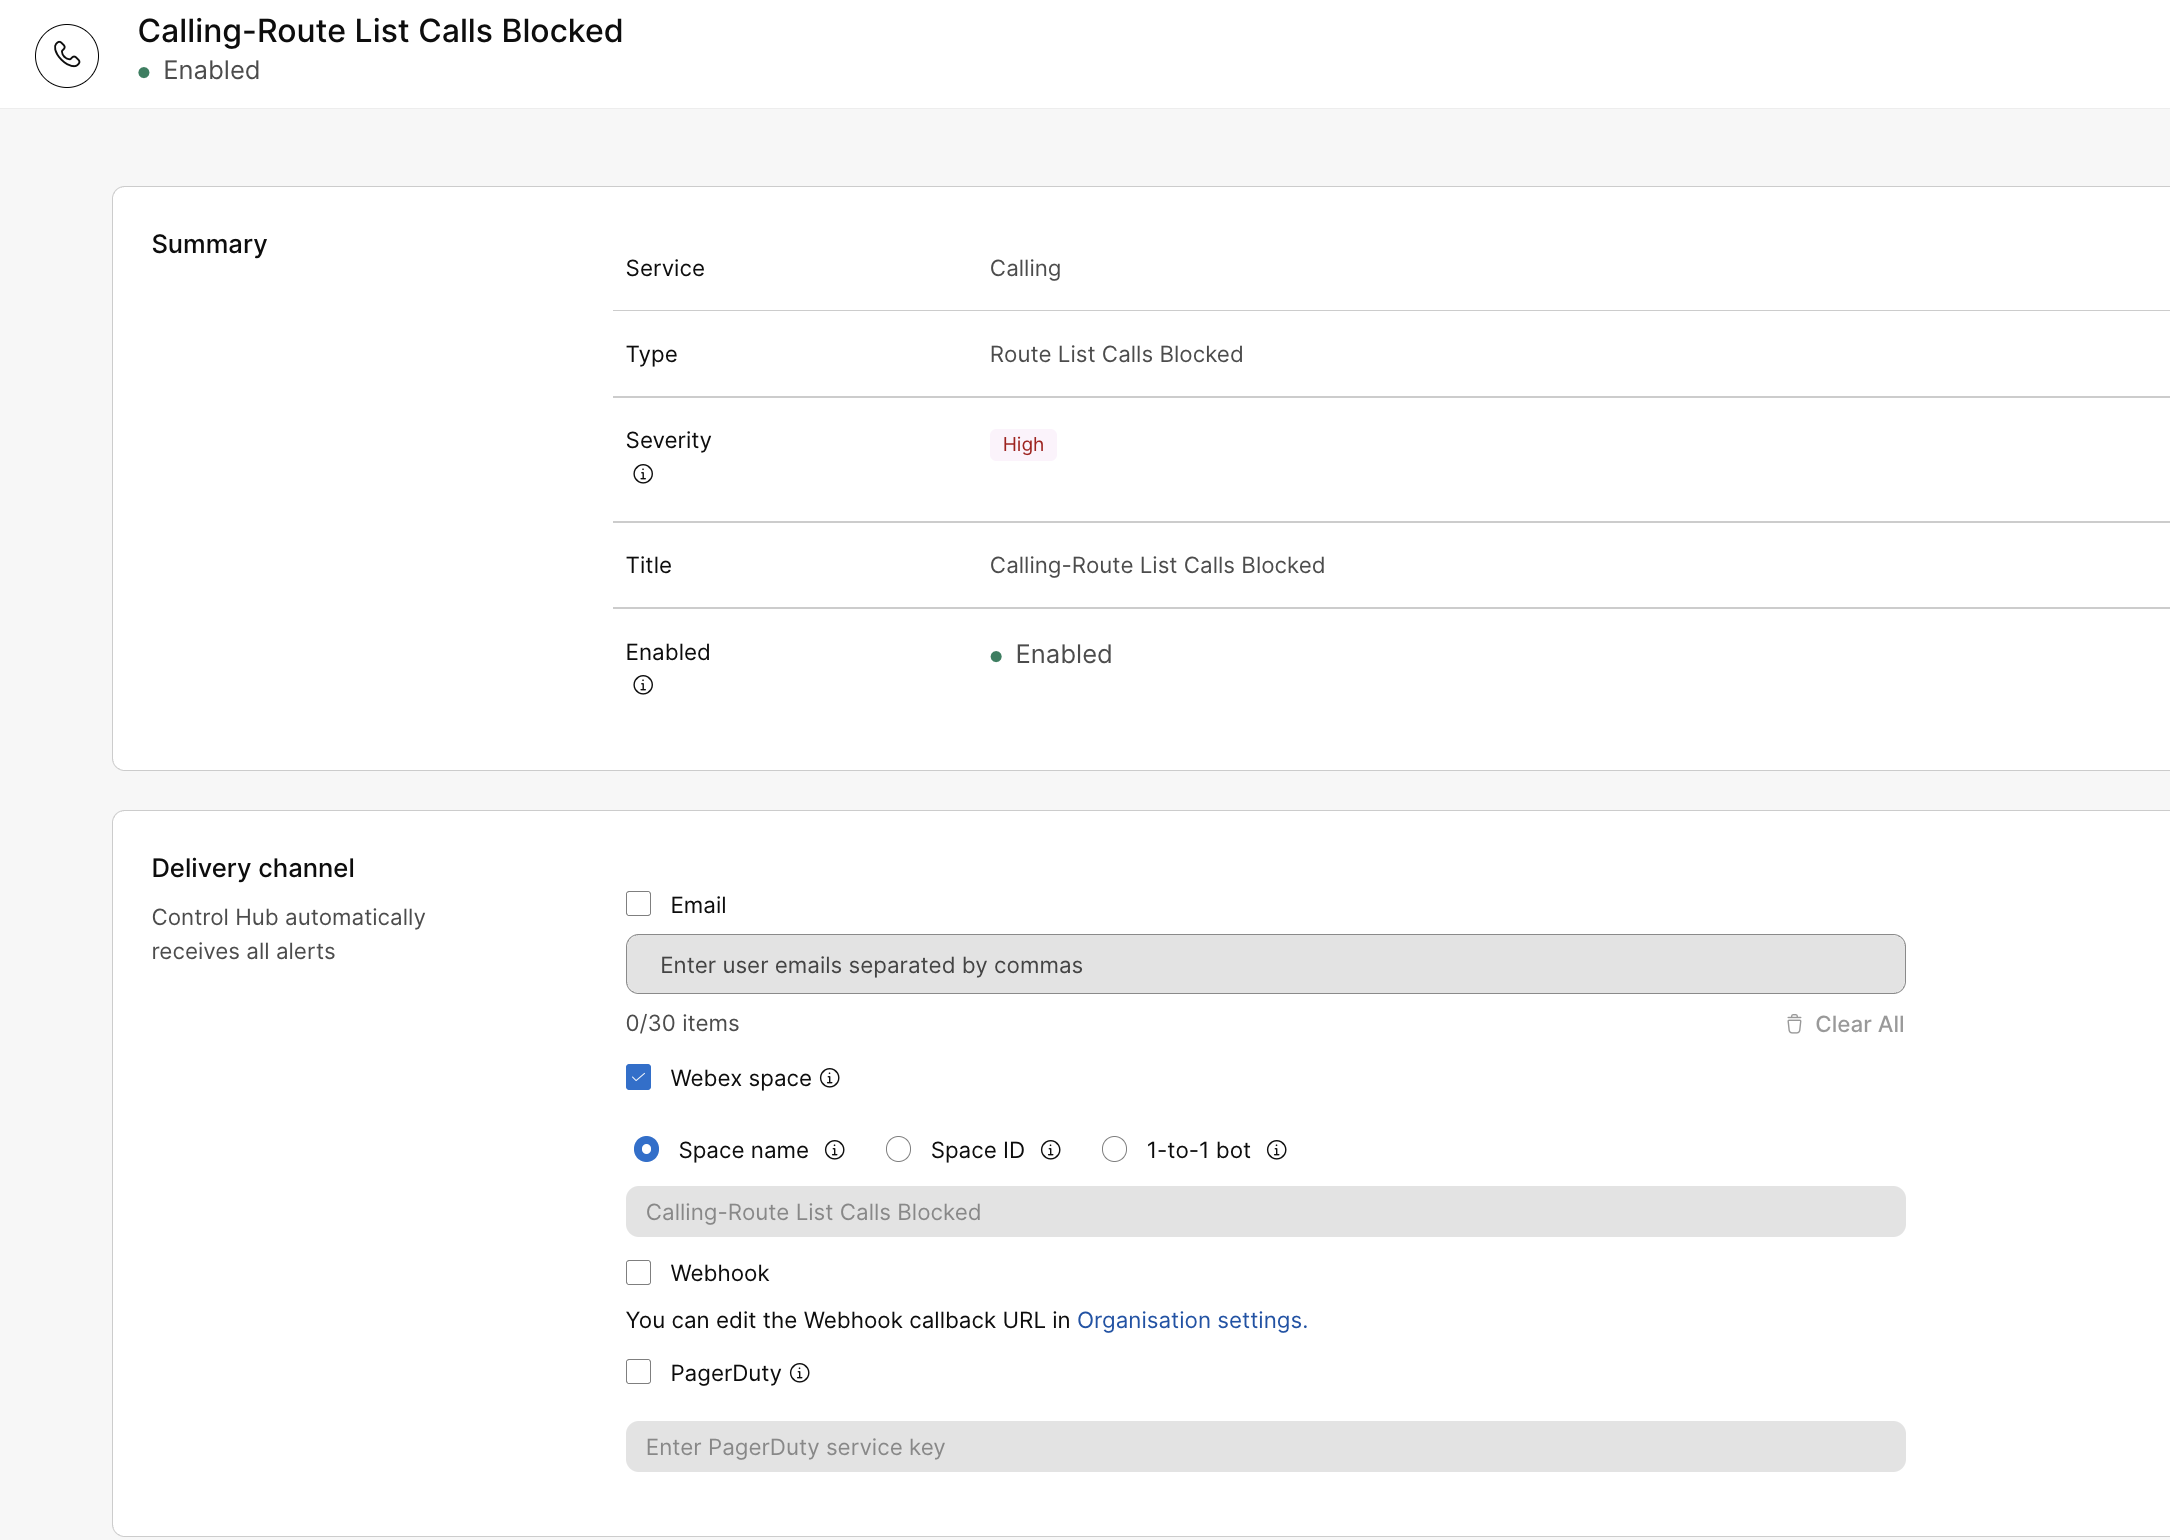
|
| 4 |
In the Delivery channel section, choose how to receive the alerts:
|
| 5 |
Click Save. |
There are two categories of service alerts for Dedicated Instance: Maintenance alerts and Proactive alerts.
Maintenance alerts
The system enables maintenance alerts by default. Partner or customer administrators should verify or configure the delivery channel to receive notifications via email and/or Webex space. Maintenance alerts are used to send notifications about maintenance, outages, and incident communication.
To add delivery channel information to receive maintenance alerts:
- Sign in to Control Hub and go to Notifications > All rules.
- Click Calling-Maintenance and Outage Alerts and scroll down to Delivery Channel.
- Select either or both of the Email or Webex spaces check boxes to receive notification on the preferred channel.
You can add upto 30 email IDs.
To receive notifications in a Webex space, you must have a Messaging license. If bot access is enabled in Apps/Bots and you're allowed to be a member of the organization room, you’ll get the notifications. Otherwise, contact your organization administrator to resolve the issue.
You can select Webhooks if you have Webhooks enabled at the organizational level. For more information, see Enable webhooks for alerts in Control Hub.
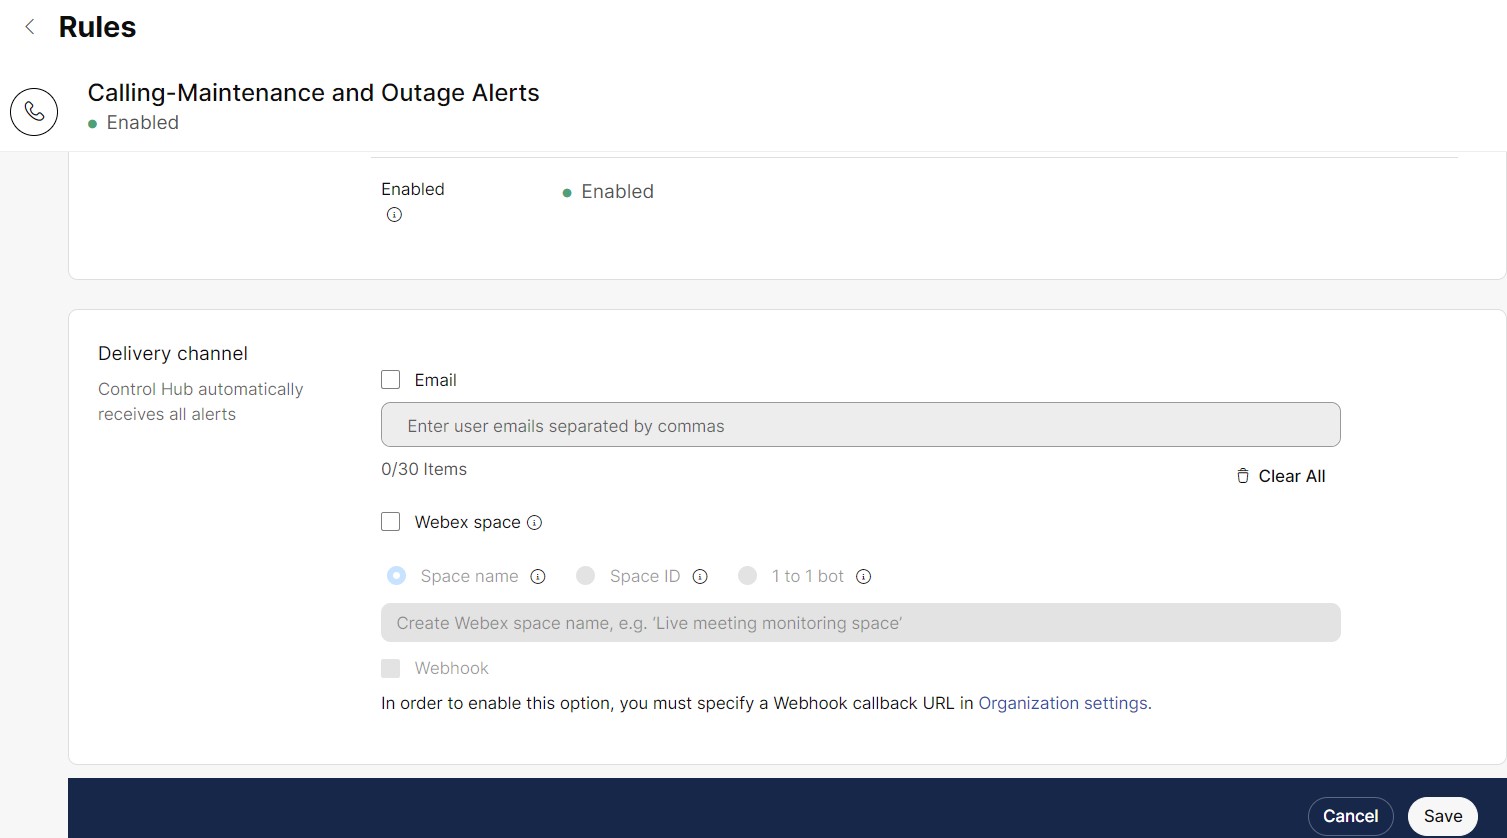
- Enter the Email and Webex space information and click Save to save the changes.
Whenever maintenance occurs, Control Hub automatically displays a banner with the cluster details, region, and the scheduled date and time.

Proactive alerts
Partner or customer administrators can subscribe to day two or day three proactive alerts and event notifications, and choose to have them delivered via email, Webex App spaces, or both by selecting the Delivery Channel when creating the alert.
For example: Unified CM Video Conf Bridge Out of Resource Count High, Unified CM MTP Out of Resource Count High.
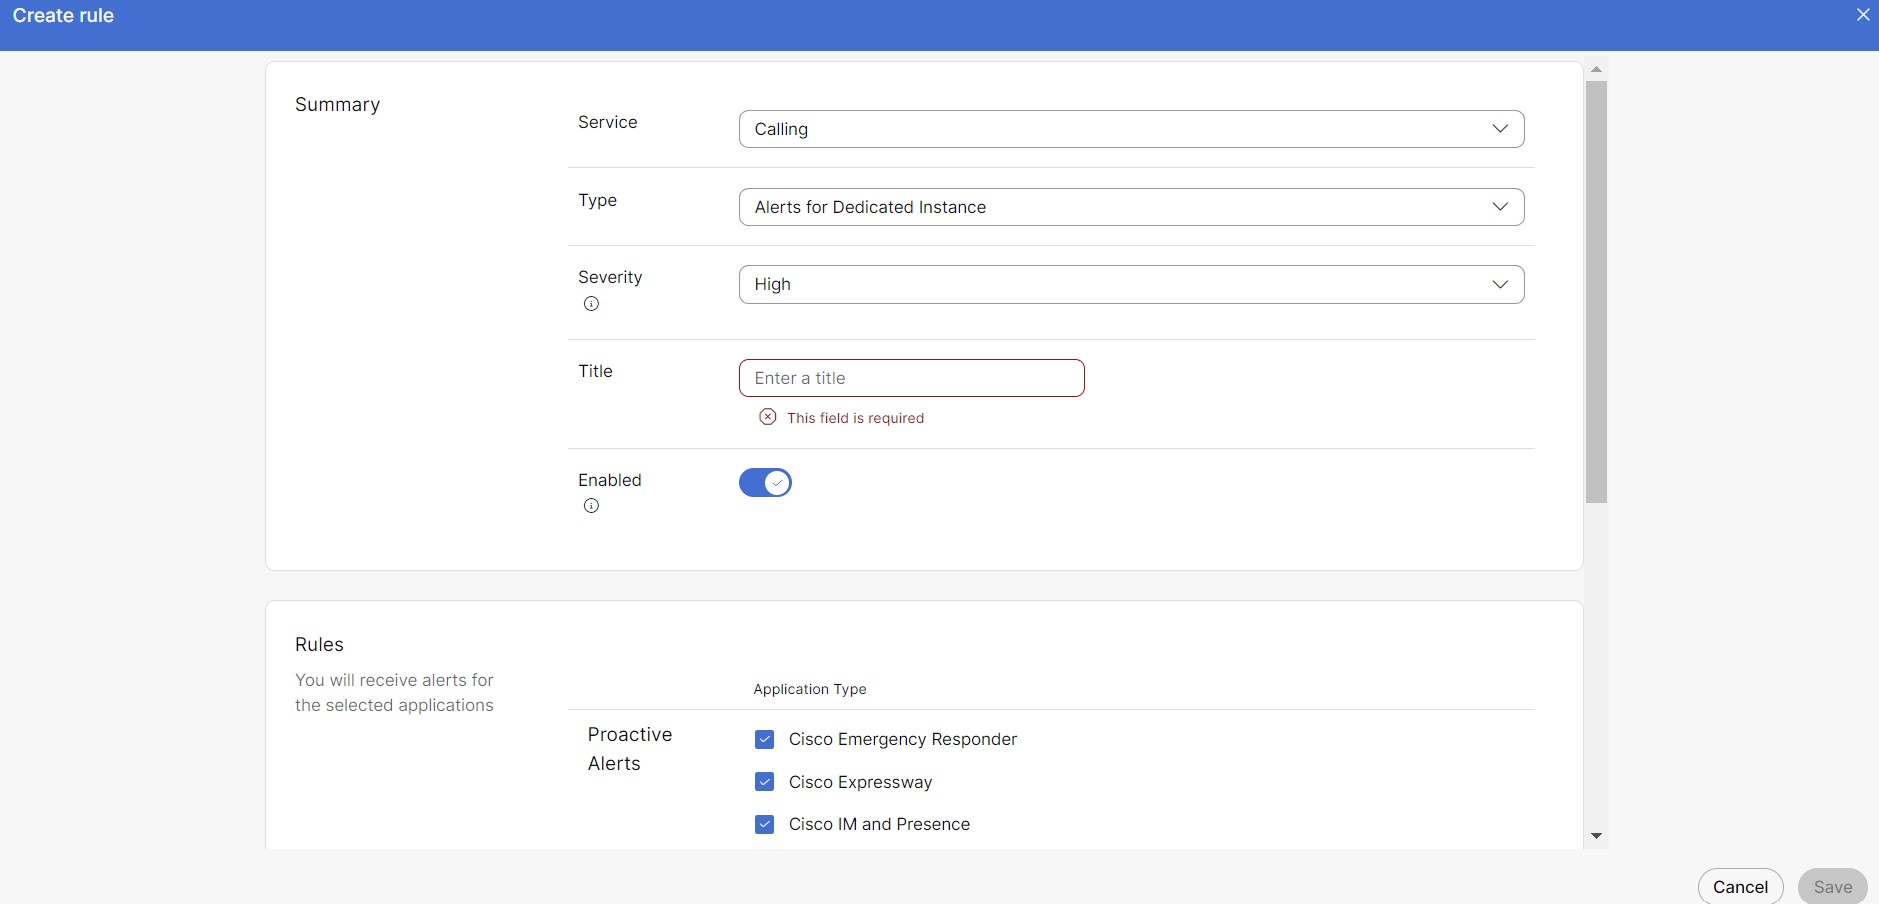
To create a proactive alert rule
Only partner or customer admin with full admin rights can create rules.
- Sign in to Control Hub and go to Notifications > My rules.
- Select Create rule.
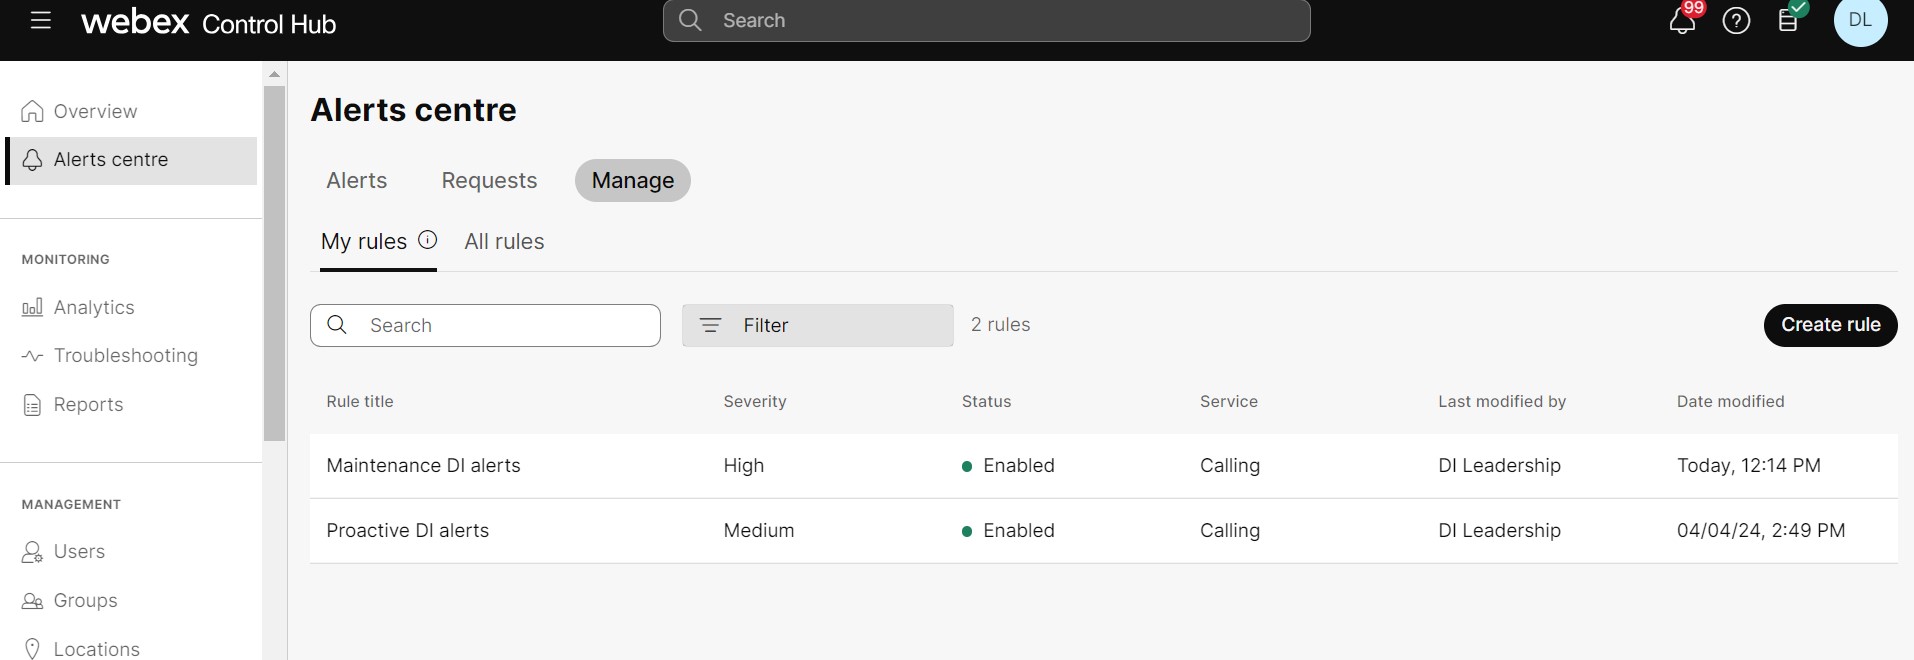
- In the Summary section:
- Select Calling from the Service drop-down list.
- Select Alerts for Dedicated Instance from the Type drop-down list.
- Select the preferred Severity. By default the severity is High.
-
We recommend creating rules for proactive alerts with medium or low severity.
-
You receive alerts that match or exceed the severity level you selected when setting up the rule.
-
- Add Title for the new rule.
- All the check boxes in the Rules section are selected by default. Uncheck the ones based on your preferences.
- Select the Delivery Channel to receive the alert.
You can select Webhooks if you have Webhooks enabled at the organizational level. For more information, see Enable webhooks for alerts in Control Hub.
- Click Save.
Once the rules are created, it takes a maximum of 6 hours to start receiving the notifications.
Alert status and their legends
Control Hub consolidates the statuses of multiple UC application services, agent statuses, and the maintenance status of each node.
Services status for each node is refreshed every 30 seconds.
|
Critical alerts |
|
|
|
|
Non-critical alerts |
|
|
All other UC services which is not listed above are considered as non-critical services. |
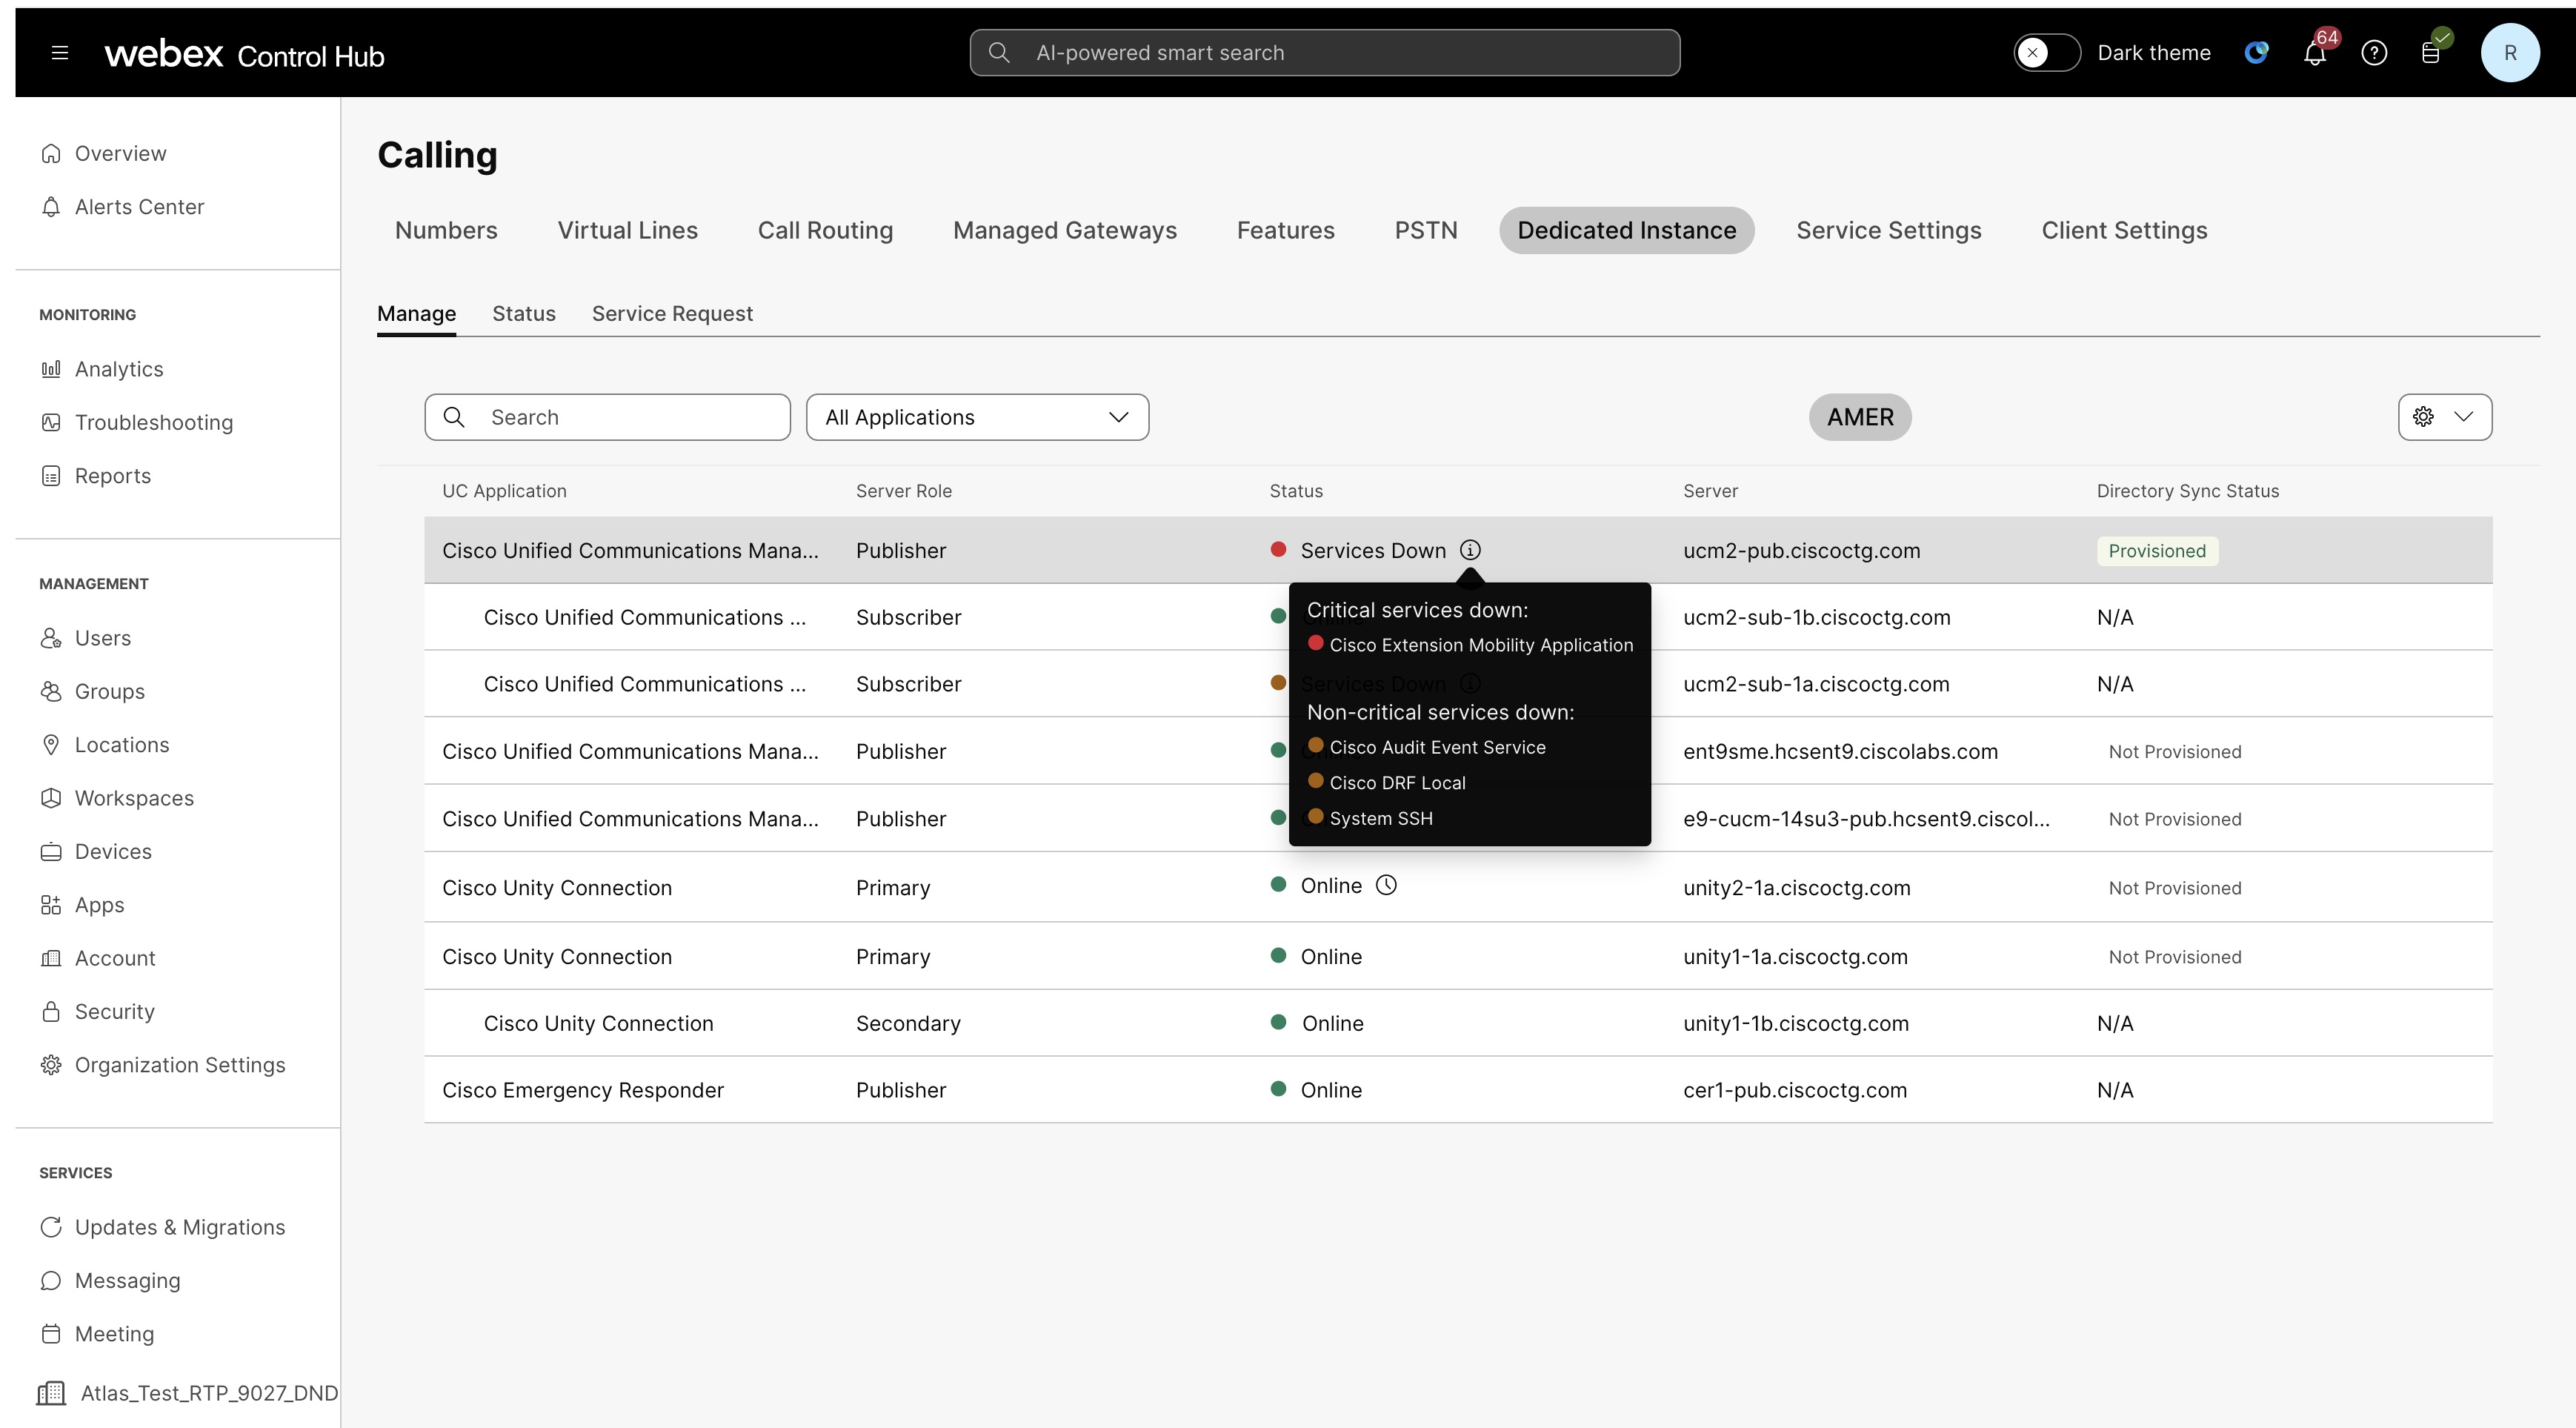
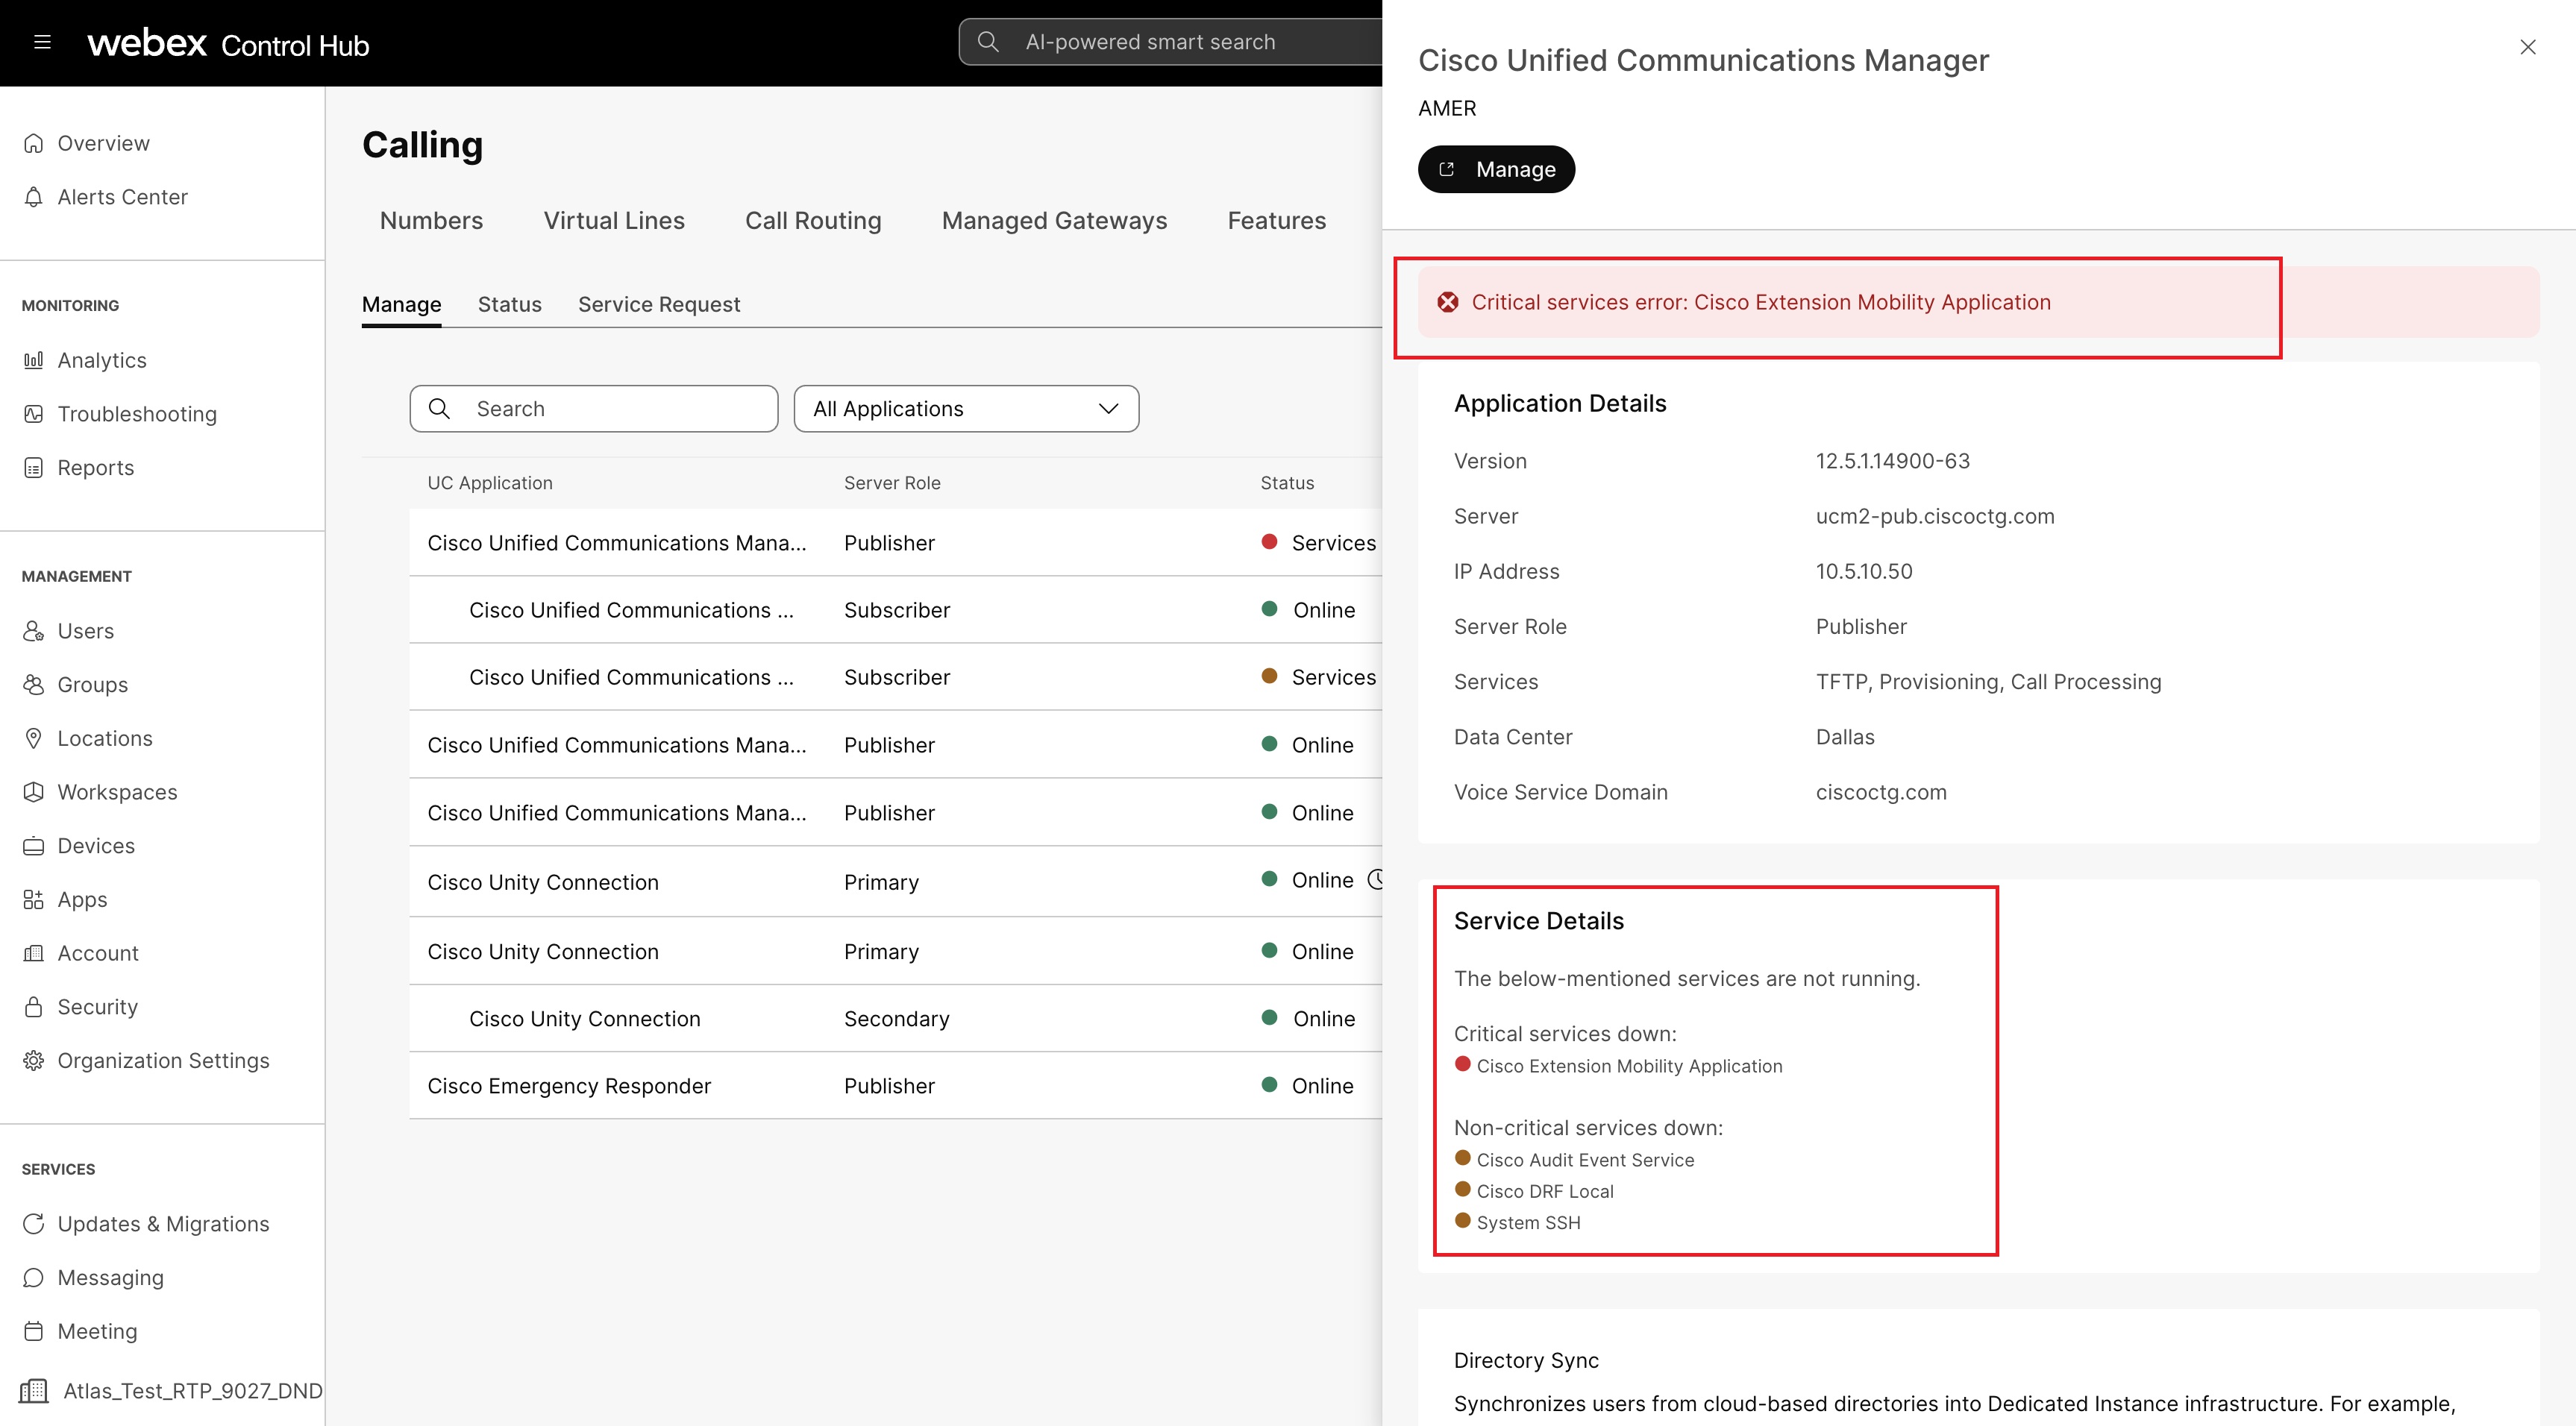
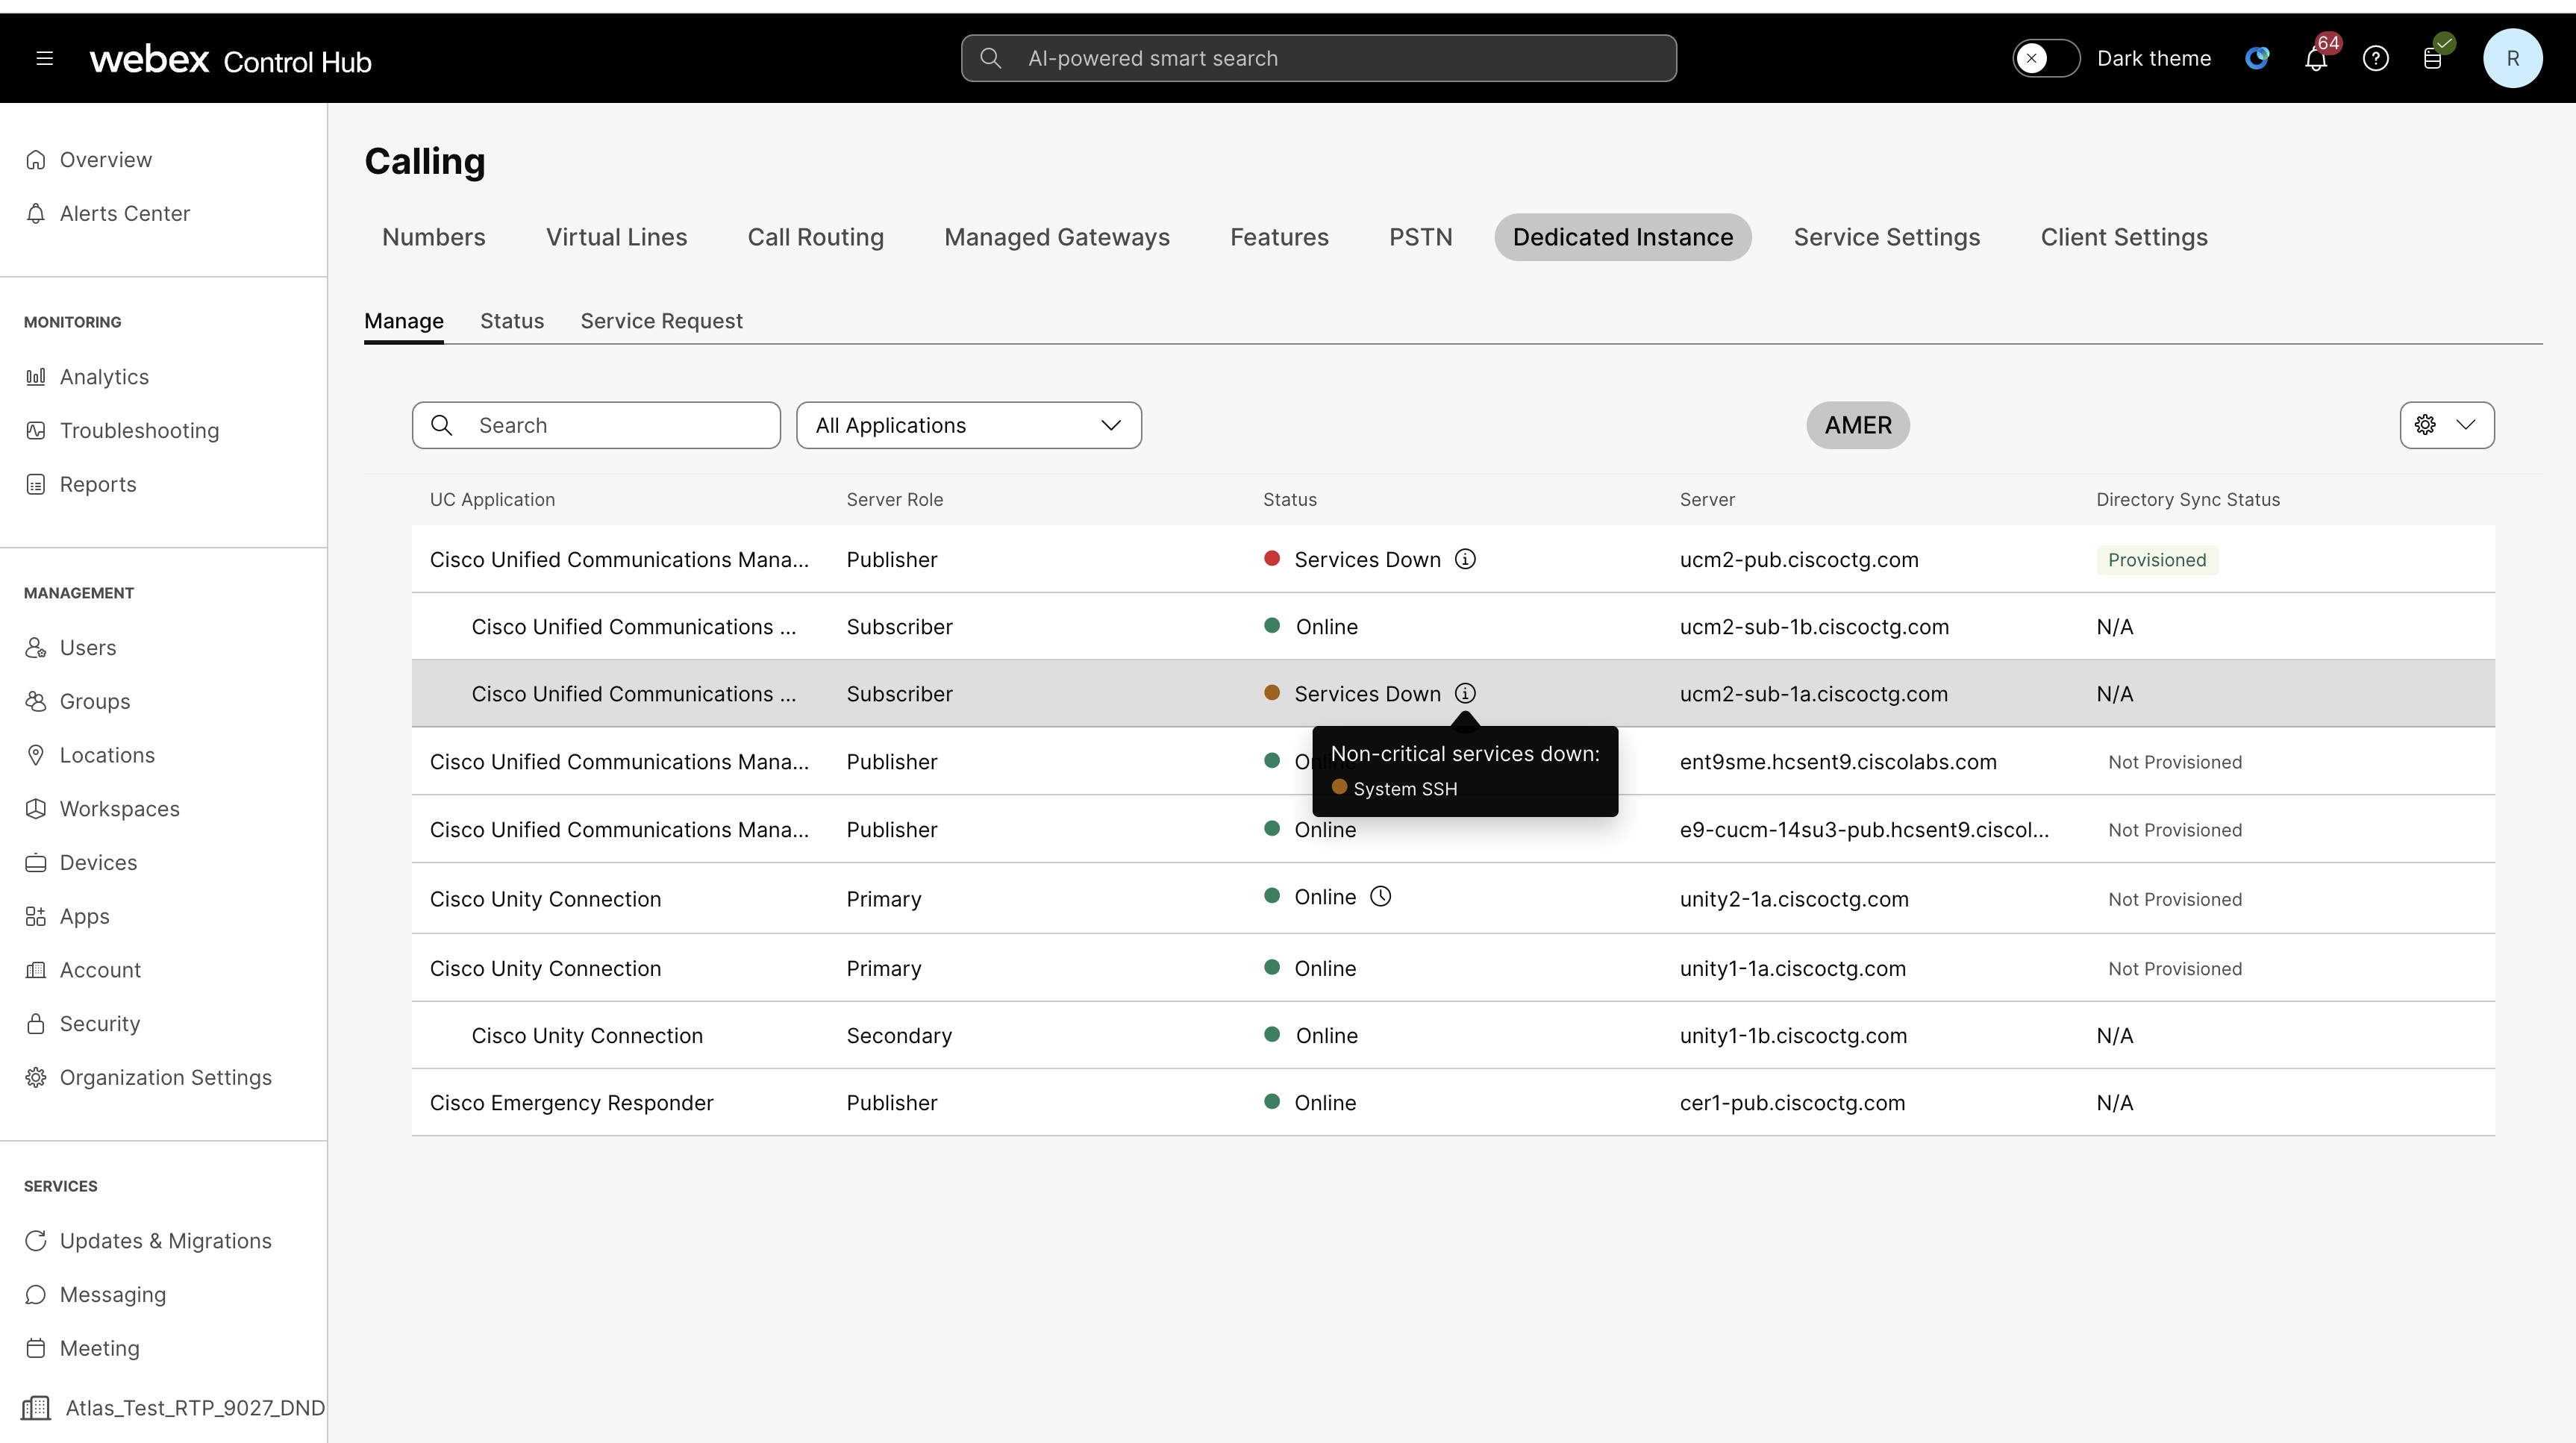
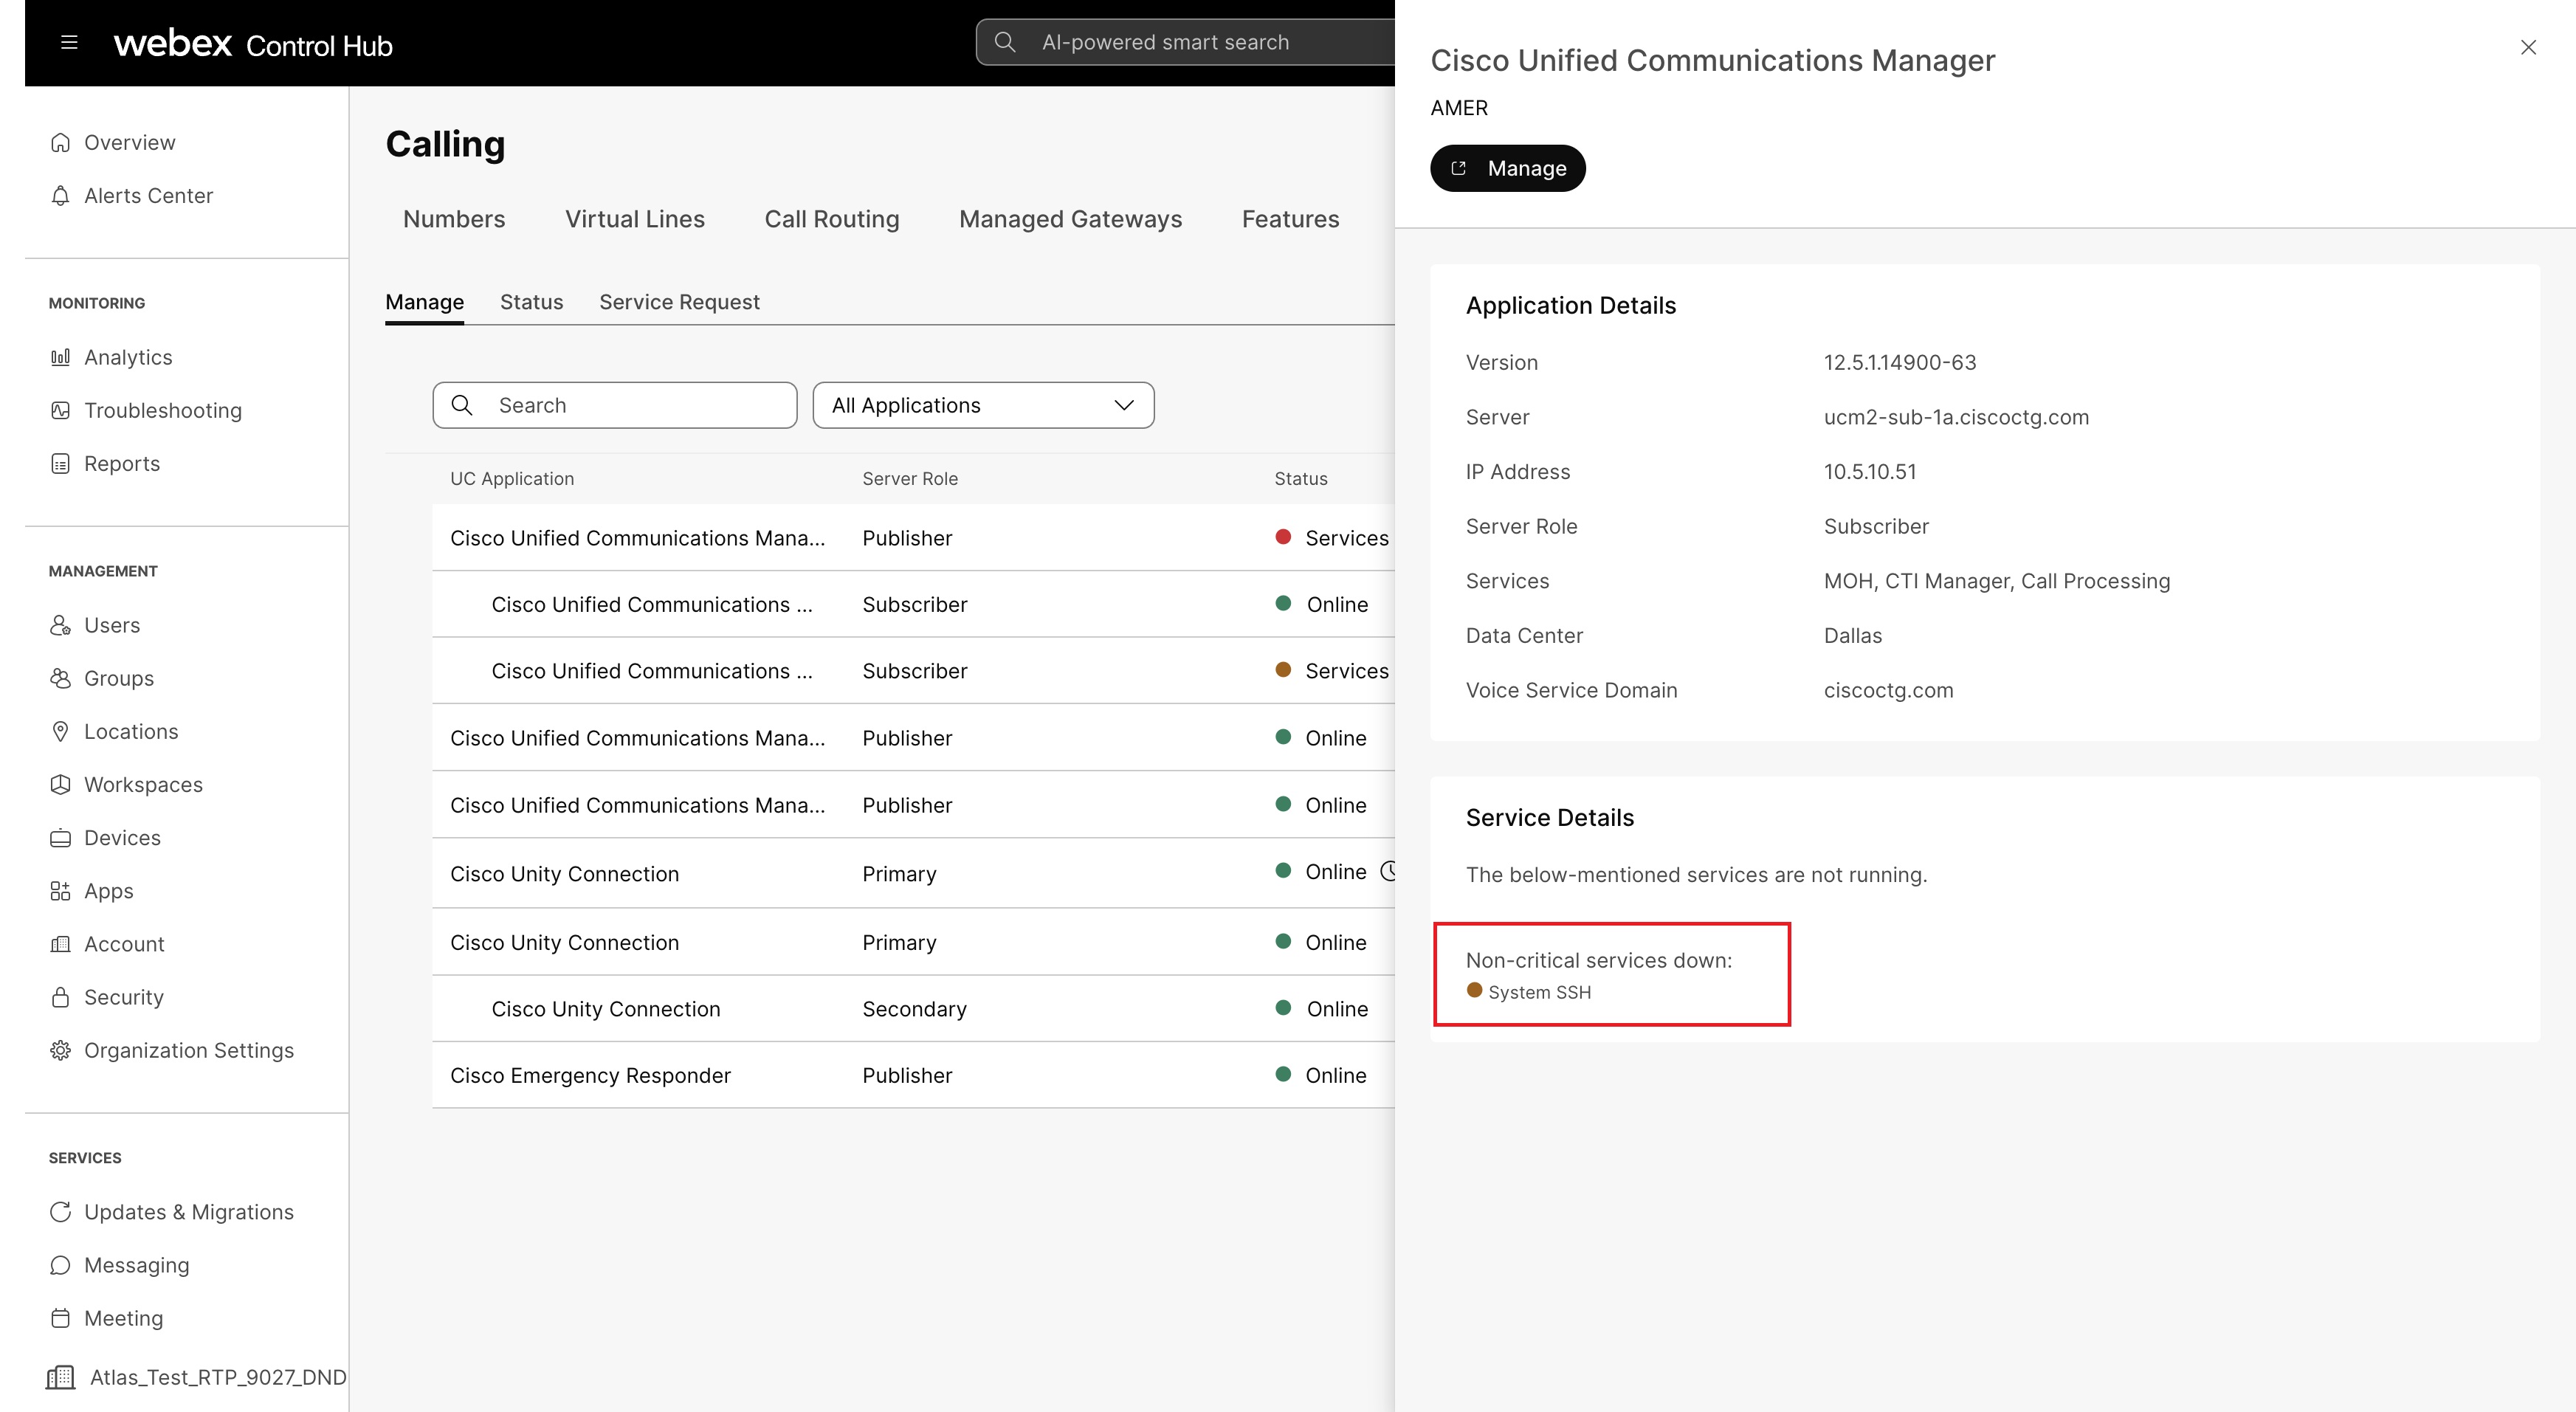
Alert legends
| Status | Color | Description |
| Online | Green | Indicates the node is functioning normally without any issues |
| Maintenance | Orange | Indicates the node is undergoing a maintenance |
| Services Down | Red | Indicates one or more critical services are down on the node |
| Services Down | Orange | Indicates one or more non-critical services are down on the node, or the agent is offline |
Certificate expiry alert
Control Hub sends certificate expiry alerts to customers 67 days before the expiration date and then every 12 days, until the certificate is renewed.
- Customer owned and managed certificates - A proactive alert is sent from Control Hub, and you’re responsible for renewing and managing the certificate.
- Cisco owned and managed certificates - A proactive alert is sent from Control Hub, and we’re responsible for renewing and managing the certificate.
Set up a proactive alert to receive a notification when a certificate expires.
Control Hub application status alarm definitions
For a list of available alarm definitions for Dedicated Instance, see Control Hub application status alarm definitions.
For Unified Communication application alerts, you can configure the below alerts:
- UC Application critical events alerts - Receive notifications for supported critical events collected from UC applications.
- AI based anomaly events alerts - Receive AI-based alerts for scenarios such as phone anomaly, phone registration, and call anomaly.
For more information, refer to Alerts in Control Hub.
Before you begin
- You must be a partner or customer administrator with full administrator rights to create alert rules.
- Messaging must be enabled for the organization if you want to send alerts to a Webex App space.
- Webhooks must be enabled at the organization level before you can use webhooks as a delivery channel.
Unified Communication application critical events
Use this rule to receive alerts for critical events. The source events come from UC applications and are mapped to the severity that the administrator chooses when creating the rule.
How to create a rule
- Sign in to Control Hub, and go to Notifications > My rules.
- Click Create rule.
- In the Summary section, configure the services rule.
- From the Service list, choose Calling.
- From the Type list, choose the Cloud Intelligence UC Application critical events.
- Select the preferred Severity.
- This field shows how severe or important an alert is. You can choose severity level as High, Medium, or Low.
- Refer to Severity table section to know more on the Control Hub and alert type severity.
- Refer to critical events list table to know more on the different alert name, description and severity level.
- Enter a title for the new rule.
- Check the alerts toggle is turned ON to receive notifications for the
alert.
When turned OFF, users won’t get alerts.
- In the Rule definition section, select the application type, and choose application cluster as all or associated cluster that should receive critical alerts.
- In the Delivery channel section, choose how to receive the alerts:
- Email—Enter the email addresses of who'll receive the alerts.
- Webex space—Enter the name of the space to receive the alert as messages in
a space. The bot only messages recipients that are added in the email delivery
channel.
Your organization must have Messaging enabled for Webex App to use a space as a delivery channel.
- Webhook—Check this check box if you want to use the alert with third-party applications.
- Click Save.
Once the rules are created, it takes a maximum of 6 hours to start receiving the notifications.
Severity Table
Monitoring sends UC application critical events alerts only for the below factors:
| Control Hub Severity | Alert Type Severity |
|---|---|
|
High Sends only the highest-priority critical events. | Critical, Alert |
|
Medium Sends high-priority events and medium-priority critical events. | Critical, Alert, Error, Warning |
|
Low Sends all supported critical events in the rule. | Critical, Alert, Error, Warning, Informational |
Critical events list
The critical events list shows the alerts that can trigger notifications for the selected severity and UC application clusters.
| Alert name | Description | Severity |
|---|---|---|
| CiscoDRFFailure | This alert occurs when the DRFFailure event is generated. | Critical |
| HardwareFailure | This alert occurs when the HardwareFailure event is generated. This indicates that hardware failure event (disk drive failures, power supply failures,...) has occured. | Critical |
| LogFileSearchStringFound | This alert occurs when the LogFileSearchStringFound event is generated. This indicates that the search string was found in the log file. | Critical |
| SyslogStringMatchFound | This alert occurs when the SyslogStringMatchFound event is generated. This indicates that a syslog message with the matching search string found. | Critical |
| SyslogSeverityMatchFound | This alert occurs when the SyslogSeverityMatchFound event is generated. This indicates that a syslog message with the matching severity level found. | Critical |
| LogPartitionHighWaterMarkExceeded | This alert occurs when the LogPartitionHighWaterMarkExceeded event is generated. This indicates that the percentage of used disk space in the log partition has exceeded the configured high water mark. | Critical |
| LogPartitionLowWaterMarkExceeded | This alert occurs when the LogPartitionLowWaterMarkExceeded event is generated. This indicates that the percentage of used disk space in the log partition has exceeded the configured low water mark. | Critical |
| SparePartitionHighWaterMarkExceeded | This alert occurs when the SparePartitionHighWaterMarkExceeded event is generated. This indicates that the percentage of used disk space in the spare partition has exceeded the configured high water mark. | Critical |
| SparePartitionLowWaterMarkExceeded | This alert occurs when the SparePartitionLowWaterMarkExceeded event is generated. This indicates that the percentage of used disk space in the spare partition has exceeded the configured low water mark. | Critical |
| CoreDumpFileFound | This alert occurs when the CoreDumpFileFound event is generated. This indicates that a core dump file has been found in the system. | Critical |
| CCMEncryptionErrorDetected | This alert occurs when the CCMEncryptionErrorDetected event is generated. | Critical |
| TCPRemoteSyslogDeliveryFailed | This alert occurs when delivery of alarms, audits or rsyslog generate events to the configured remote syslog server(s) fails. The reason could be that the configured syslog server is down, or TCP is not configured on port 601, or there is a network failure. | Critical |
| TLSRemoteSyslogDeliveryFailed | This alert occurs when delivery of alarms, audits or rsyslog generate events to the configured remote syslog server(s) fails. The reason could be that the configured syslog server is down, or TLS over TCP is not configured on port 6514, or there is a network failure, or certificate of remote syslog server might not have uploaded to Unified CM's Tomcat trust. | Critical |
| UnreachableRemoteSyslogServer | This alert occurs when the remote syslog server configured for a service is not reachable. The reason could be the syslog server configured is invalid, or when the syslog server is down, or when the syslog server is not configured to UDP/TCP/TLS protocols for the ports 514/601/6514. | Alert |
| AuditLogOverflowDueToLPMPurge | This alarm indicates an overflow occurred due to purge by LPM clean up logic. When the total disk space usage of log partition crosses the high water mark configured, the LPM tool's clean up logic deletes the oldest files from the log partition so that the new logs can be written. | Alert |
| AuthenticationFailed | This alert is triggered when the number of AuthenticationFailed events exceeds (configured) threshold during the (configured) time interval. This AuthenticationFailed event occurs when there is authentication failure in login attempt. | Alert |
| TotalProcessesAndThreadsExceededThreshold | This alert occurs when the TotalProcessesAndThreadsExceededThresholdStart event is generated. This indicates that the current total number of processes and threads have exceeded the maximum number of tasks configured for Cisco RIS Data Collector Service Parameter. This situation could indicate some process is leaking or some process has thread leaking. | Alert |
| LowActivePartitionAvailableDiskSpace | This alert occurs when the percentage of available disk space of the Active Partition is lower than the configured value. | Alert |
| LowInactivePartitionAvailableDiskSpace | This alert occurs when the percentage of available disk space of the Inactive Partition is lower than the configured value. | Alert |
| LowSwapPartitionAvailableDiskSpace | This alert occurs when the percentage of available disk space of the Swap Partition is lower than the configured value. | Alert |
| DBReplicationFailure | This alert occurs when there are CallManager database replication errors. | Alert |
| DBChangeNotifyFailure | This alert occurs when Cisco Database Notification Service is experiencing problems and could be halted. This condition indicates Change Notification Requests Queued in DB are stuck and changes made to the system are not taking effect. | Alert |
| CpuPegging | This alert occurs when the percentage of CPU load on a server is over the configured percentage for the configured period of time. | Alert |
| LowAvailableVirtualMemory | This alert occurs when the percentage of available virtual memory is lower than the configured value. | Alert |
| CriticalServiceDown | This alert occurs when service operational status is DOWN. | Alert |
| ServerDown | This alert occurs when the remote node is unreachable. | Alert |
| SystemVersionMismatched | This alert occurs when there is mismatch in system version. | Alert |
| DBReplicationTableOutOfSync | This alert is triggered when the IDSReplicationFailure event(s) with alarm number 888 occurs. One or more tables could be out of sync. Please contact Cisco TAC and schedule maintenance. | Alert |
| AuditLogsExceedsConfiguredThreshold | This alarm indicates the percentage of disk space configured for application audit logging exceeds the configured threshold. Audit logs files will be overwritten sooner or later depends on the frequency of audit logging by the CUCM applications. | Alert |
| AuditLogOverFlowDueToLogRotation | This alarm indicates that the audit log overflow occurred. An existing audit log file is overwritten resulting in overflow and eventual loss of audit data. | Alert |
| CiscoHAProxyServiceDown | This alert occurs when Cisco HAProxy Service goes down. | Alert |
| SurvivabilityEvent | This alert occurs when none of the Webex Calling Dedicated Instance nodes are reachable. | Critical |
| RemoteSurvivableNodeNotReachable | This alert occurs when one or more Remote Survivable node(s) are not reachable to Webex Calling Dedicated Instance node(s). | Critical |
| CARSchedulerJobFailed | This alert occurs when the CARSchedulerJobFailed event is generated. This indicates that the CAR scheduled job failed. | Critical |
| CARIDSEngineCritical | This alert occurs when the CARIDSEngineCritical event is generated. This alarm does not compromise data or prevent the use of the system. | Critical |
| CARIDSEngineFailure | This alert occurs when the CARIDSEngineFailure event is generated. This is combined alarm for emergency and error situations. Something unexpected occurred that might compromise data or access to data or cause CAR IDS to fail. | Critical |
| CallAttemptBlockedByPolicy | This alert occurs when the CallAttemptBlockedByPolicy event(s) is generated. This indicates that a call was attempted but blocked or rejected by the policy decision point (PDP). | Critical |
| EMCCFailedInLocalCluster | This alert occurs when the EMCCFailedInLocalCluster event(s) is generated. This indicates that there is EMCC Login failure in local Call Manager. | Critical |
| EMCCFailedInRemoteCluster | This alert occurs when the EMCCFailedInRemoteCluster event(s) is generated. This indicates that there is EMCC Login failure at a remote Call Manager. | Critical |
| UserInputFailure | This alert occurs when the UserInputFailure event(s) is generated. This indicates that there is EMCC Login failure due to invalid user input. | Critical |
| NumberOfRegisteredDevicesExceeded | This alert occurs when the NumDevRegExceeded event(s) is generated. | Critical |
| CDRAgentSendFileFailed | This alert occurs when the CDRAgentSendFileFailed event is generated. This indicates that CDR Agent cannot send CDR files from CCM node to CDR Repository node within the CCM cluster. | Critical |
| CDRFileDeliveryFailed | This alert occurs when the CDRFileDeliveryFailed event is generated. This indicates that FTP delivery of CDR files to the outside billing server failed. | Critical |
| CDRFileDeliveryFailureContinues | This alert occurs when the CDRFileDeliveryFailureContinues event is generated. This indicates that FTP delivery of CDR files to the outside remote server failed after 3 or more attempts. | Critical |
| CDRHighWaterMarkExceeded | This alert occurs when the CDRHWMExceeded event is generated. This indicates that High Water Mark for CDR files reached, some successfully delivered CDR files have been deleted. | Critical |
| CDRMaximumDiskSpaceExceeded | This alert occurs when the CDRMaximumDiskSpaceExceeded event is generated. This indicates that The CDR files disk usage exceeded maximum disk allocation. Some undelivered files have been deleted. | Critical |
| MaliciousCallTrace | This alert occurs when the MaliciousCall event is generated. | Critical |
| TCPSetupToIMEFailed | This alert occurs when the TCPSetupToIMEFailed event is generated. This alarm occurs when Unified CM is unable to establish a TCP connection to an IME server. It typically occurs when the IP address and port of the IME server are misconfigured or an Intranet connectivity problem is preventing the connection from being set up. | Critical |
| TLSConnectionToIMEFailed | This alert occurs when the TLSConnectionToIMEFailed event is generated. A TLS connection to the IME server could not be established because of a problem with the certificate presented by the IME server. (For example, not in the Unified CM CTL, or is in the CTL but has expired). | Critical |
| InvalidCredentials | This alert occurs when the InvalidCredentials event is generated. The connection to the IME server could not be completed, because the username and/or password configured on Unified CM do not match those configured on the IME server | Critical |
| IMEOverQuota | This alert occurs when the IMEOverQuota event is generated. Each IME server has a fixed quota on the total number of DIDs it can write into the IME distributed cache. When this alarm is generated, it means that, across all of the Unified CM clusters which are utilizing the same IME server, the quota for the IME distributed cache has been exceeded. | Critical |
| IMEDistributedCacheInactive | This alert occurs when the IMEDistributedCacheInactive event is generated. This alarm is generated when Unified CM attempts to connect to the IME server, however, the IME distributed cache is not currently active | Critical |
| InsufficientFallbackIdentifiers | This alert occurs when the InsufficientFallbackIdentifiers event is generated. This alarm is generated when Unified CM is processing a IME call, and is attempting to allocate a PSTN fallback DID and a DTMF digit sequence to associate with this call. However, there are too many IME calls currently in progress which are utilizing this same fallback DID, and as a result, there are no more DTMF digit sequences which could be allocated to this call. As such, this call will proceed, however mid-call fallback will not be possible for this call. | Critical |
| SmartLicenseInEval | The system is operating in Evaluation Mode that will expire soon. | Critical |
| SmartLicenseNoProvision_EvalExpired | The license evaluation period has expired. | Critical |
| SmartLicenseInOverage_AuthorizationExpired | The license authorization has expired. | Critical |
| SmartLicenseNoProvision_AuthorizationExpired | The license authorization has expired. | Critical |
| SmartLicenseRegistrationExpired | The license registration has expired and the system is unregistered with Cisco Smart Software Manager or satellite | Critical |
| SmartLicenseInOverage_OutOfCompliance | The system is operating with an insufficient number of licenses. | Critical |
| SmartLicenseNoProvision_OutOfCompliance | The system is operating with insufficient number of licenses. | Critical |
| SmartLicenseCommunicationError | The system failed to communicate with Cisco Smart Software Manager or satellite | Critical |
| SmartLicenseRegistrationExpiringSoon | The registration with Cisco Smart Software Manager or satellite will expire soon. | Critical |
| SmartLicenseAuthorizationExpiringSoon | The license authorization period will expire soon. | Critical |
| SmartLicenseRenewAuthFailed | The license authorization renewal failed. | Critical |
| SmartLicenseRenewRegistrationFailed | The license registration renewal failed. | Critical |
| SmartLicenseExportControlNotAllowed | This Unified Communications Manager is not licensed to operate in Mixed mode | Critical |
| SmartLicense_Reservation_InEval | License Reservation is enabled on this system and the system is operating in Evaluation Mode that will expire soon. | Critical |
| SmartLicense_Reservation_NoProvision_EvalExpired | License Reservation is enabled on this system and the license evaluation period has expired. | Critical |
| SmartLicense_SLR_InOverage_NotAuthorized | License Reservation is enabled on this system. This system is operating with an insufficient number of licenses and the overage period is active. | Critical |
| SmartLicense_SLR_NoProvision_NotAuthorized | License Reservation is enabled on this system. This system is operating with an insufficient number of licenses and the overage period has expired. | Critical |
| SmartLicense_Reservation_ExportControlNotAllowed | License reservation is enabled and this system is not licensed to operate in Mixed mode. | Critical |
| IMEQualityAlert | This alert occurs when the IMEQualityAlertEntry event is generated. This alarm is generated when Unified CM is seeing a substantial number of IME calls fail back to PSTN, or fail to be set up, due to IP network quality problems. There are two triggers for this alarm. One is when a large fraction of the currently active IME calls have all requested fallback, or have fallen back, to the PSTN. The other is when a large fraction of the recent call attempts have not been made over IP, and instead have gone to the PSTN. | Critical |
| SmartLicenseCommunication | System failed to establish communication using Smart Transport mode, hence will continue to use Call Home for communication with Cisco Smart Software Manager or Satellite. | Critical |
| RouteListExhausted | This alert occurs when the number of RouteListExhausted events exceeds the configured threshold during the configured time interval. This indicates that all available channels defined in route list are busy. | Critical |
| ExcessiveVoiceQualityReports | This alert occurs when the number of voice quality reports exceeds the configured threshold during the configured time interval. | Critical |
| MediaListExhausted | This alert occurs when either the number of MediaResourceListExhausted events exceed the configured threshold during the configured time interval or there may be a configuration problem. This indicates that all available media resources defined in media list are busy or that a medial resource cannot be allocated. | Critical |
| BeginThrottlingCallListBLFSubscriptions | This alert occurs when the BeginThrottlingCallListBLFSubscriptions event is generated. This indicates that Cisco CallManager has initiated a throttling of the CallList BLF Subscriptions in order to prevent a system overload. | Critical |
| CodeYellow | This alert occurs when the Cisco CallManager CodeYellowEntry event is generated. | Critical |
| SDLLinkOutOfService | This alert occurs when the SDLLinkOOS event is generated. This event indicates that the local Cisco CallManager has lost communication with the remote Cisco CallManager. This event usually indicates network errors or a nonrunning remote Cisco CallManager. | Critical |
| RTMTSessionsExceedsThreshold | This alert occurs when the number of RTMT sessions is over the configured threshold. | Critical |
| NumberOfRegisteredGatewaysIncreased | This alert occurs when the number of registered gateways in the cluster increased between consecutive polls. | Critical |
| NumberOfRegisteredGatewaysDecreased | This alert occurs when the number of registered gateways in the cluster decreased between consecutive polls. | Critical |
| NumberOfRegisteredMediaDevicesIncreased | This alert occurs when the number of registered media devices in the cluster increased between consecutive polls. | Critical |
| NumberOfRegisteredMediaDevicesDecreased | This alert occurs when the number of registered media devices in the cluster decreased between consecutive polls. | Critical |
| NumberOfRegisteredPhonesDropped | This alert occurs when the number of registered phones in the cluster drop more than the configured percentage between consecutive polls. | Critical |
| CallProcessingNodeCpuPegging | This alert occurs when the percentage of CPU load on a call processing server exceeds the configured percentage for the configured period of time | Critical |
| DDRBlockPrevention | This alert is triggered when the IDSReplicationFailure event(s) with alarm number 31 occurs. Invoking proactive procedure to avoid denial of service. This procedure will not impact call processing. Please ignore replication alarms during this process.The procedure takes up to 60 minutes to finish, please check RTMT replication status to be 2 on each node to make sure the procedure is complete. Do not perform a system reboot during this process. | Critical |
| DDRDown | This alert is triggered when the IDSReplicationFailure event(s) with alarm number 32 occurs. An auto recover procedure is running at the background and there is no action needed. The procedure takes about 15 minutes to finish, please check RTMT replication status to be 2 on each node to make sure the procedure is complete. | Critical |
| MgcpDChannelOutOfService | This alert occurs when MGCP DChannel is out-of-service | Critical |
| IMEServiceStatus | This alert is raised when the IMEServiceStatus counter value is 2=Unhealthy. This indicates the health status of this instance of the IME service. A value of 0 indicates an unknown status, likely indicating that the IME service has not been activated. A value of 1 indicates healthy: the IME service has been activated and successfully completed handshake procedures with the IME server. A value of 2 indicates unhealthy: the IME service has been activated but has not successfully completed handshake procedures with the IME server. Note that if a secondary IME server is configured for the IME service, this counter reflects the handshake status of both the primary and the secondary IME servers. | Critical |
| LocationOutOfResource | This alert occurs when LocationOutOfResource event is generated. This indicates that one or all of audio or video or immersive bandwidth for a location or link is used up. | Critical |
| ILSTLSAuthenticationFailed | This alert occurs when the ILSTLSAuthenticationFailed event is generated. A TLS connection to the remote ILS service could not be established because of a problem with the certificate presented by the remote cluster. (For example, not in the Unified CM CTL, or is in the CTL but has expired).If you are using CA Signed Identity Certificates without exchanging certificates, the Password must be provisioned with " Use TLS Certificate ". | Critical |
| ILSPwdAuthenticationFailed | This alert occurs when the ILSPwdAuthenticationFailed event is generated. A connection to the remote ILS service could not be established because of a password authentication problem with the the remote cluster. | Critical |
| ILSHubClusterUnreachable | This alert occurs when the ILSHubClusterUnreachable event is generated. A connection to the remote ILS server could not be established. ILS will periodically re-attempt to connect to the hub cluster. If the condition is due to a temporary Internet connectivity issue, the problem will self-repair. | Critical |
| RecordingGatewayRegistrationRejected | This alert occurs when the RecordingGatewayRegistrationRejected event(s) is generated. Registration to recording-enabled gateway rejected after multiple attempts. | Critical |
| RecordingGatewayRegistrationTimeout | This alert occurs when the RecordingGatewayRegistrationTimeout event(s) is generated. No response from recording-enabled gateway after multiple attempts; timeout occurred; gateway marked out-of-service | Critical |
| RecordingResourcesNotAvailable | This alert occurs when the RecordingResourcesNotAvailable event(s) is generated. Recording media resources not available (Phone or Gateway) | Critical |
| RecordingGatewaySessionFailed | This alert occurs when the RecordingGatewaySessionFailed event(s) is generated. Gateway recording session terminated unexpectedly | Critical |
| RecordingCallSetupFail | This alert occurs when the RecordingCallSetupFail event(s) is generated. Event is triggered when either Recording call setup failed or Recording request to other cluster timed out | Critical |
| RecordingSessionTerminatedUnexpectedly | This alert occurs when the RecordingSessionTerminatedUnexpectedly event(s) is generated. Event is triggered when the recording session terminates unexpectedly | Critical |
| ILSDuplicateURI | This alert occurs when the Cisco Unified Communications Manager identifies that it has learned duplicate URI entries via ILS during a call to the URI. Whenever there are duplicate entries for a URI(such as the URI user@example.com existing on two clusters), the call will always be routed to the cluster from which the URI that was first learned. Calls will not be routed to the other duplicate entries. | Critical |
| ILSPeerLimitApproachingWarning | The current peer count has reached 90% or more of the ILS network capacity. | Critical |
| ILSPeerLimitExceeded | The number of peers for this cluster in the ILS network is more than the limit set for ILSP_MSG_PEER_MAX. The system will be allowed to add spokes, hubs, and imported catalogs continuously; however, only max number of peers will be advertised to the ILS network. | Critical |
| SwitchesAndAccessPointReached75PercentCapacity | The current record count for switches and access points has reached 75% of maximum capacity of 50000 records. | Critical |
| SwitchesAndAccessPointReached90PercentCapacity | The current record count for switches and access points has reached 90% of maximum capacity of 50000 records. | Critical |
| SwitchesAndAccessPointReached95PercentCapacity | The current record count for switches and access points has reached 95% of maximum capacity of 50000 records. | Critical |
| CiscoWLCSyncServiceDown | Exceeded maximum number of devices(50000) in the Switches and Access points. | Critical |
| LegacyCUPCLogin | A legacy Cisco Unified Personal Communicator client attempted to login to the Cisco Client Profile Agent service | Critical |
| InterclusterSyncAgentPeerDuplicate | Cisco Intercluster Sync Agent service failed to sync with remote peer | Critical |
| ICSACertificateFingerPrintMisMatch | Cisco Intercluster Sync Agent service detected a fingerprint mismatch on the certificate being processed | Critical |
| ICSACertificateValidationFailure | Cisco Intercluster Sync Agent service detected a validation error on the certificate being processed | Critical |
| ICSACertificateSyncConnectionRefused | Cisco InterCluster Sync Agent Service detected a connection refused error as the port 37239 was not accessible while processing the certificate. | Critical |
| ICSACertificateCASignedTrustCertFound | Cisco Intercluster Sync Agent service detected a signed CA trust certificate | Critical |
| ICSACertificateCAConflict | Cisco Intercluster Sync Agent service detected a CA certificate conflict | Critical |
| EspConfigAgentMemAllocError | Cisco Config Agent service was unable to allocate memory | Critical |
| EspConfigAgentFileWriteError | Cisco Config Agent service was unable to write to the filesystem | Critical |
| EspConfigAgentSharedMemoryStaticRouteError | Cisco Config Agent service could not access static route shared memory | Critical |
| EspConfigAgentNetworkOutage | Cisco Config Agent network outage | Critical |
| EspConfigAgentNetworkRestored | Cisco Config Agent network restored | Critical |
| EspConfigAgentHighMemoryUtilization | Virtual memory utilization has exceeded the configured threshold | Critical |
| EspConfigAgentHighCPUUtilization | CPU utilization has exceeded the configured threshold | Critical |
| EspConfigAgentLocalDBAccessError | Cisco Config Agent service was unable to access the local database | Critical |
| EspConfigAgentRemoteDBAccessError | Cisco Config Agent service was unable to access a remote IM and Presence database | Critical |
| EspConfigAgentProxyDomainNotConfigured | Cisco Config Agent service requires that the Default IM Domain is configured | Critical |
| PEDatabaseError | Information lookup failed | Critical |
| PEPeerNodeFailure | The Cisco Presence Engine service on the peer node of a subcluster has failed | Error |
| PEAutoRecoveryFailed | Cisco Presence Engine service auto-recovery failure | Error |
| PELoadHighWaterMark | Indicates the Cisco Presence Engine service has exceeded a CPU utilization threshold | Error |
| PEIDStoIMDBDatabaseSyncError | Synchronization between the Cisco Unified CM IM and Presence database and the Cisco Unified Presence Engine database has failed | Error |
| PEIDSSubscribeError | The Cisco Presence Engine service was unable to subscribe for Cisco Unified CM IM and Presence database change notifications | Error |
| PEIDSQueryError | The Cisco Presence Engine service has detected an error while querying the Cisco Unified CM IM and Presence database | Error |
| PEMemoryHighCondition | Indicates the Cisco Presence Engine service has hit a high memory threshold | Error |
| PESipSocketBindFailure | Cisco Presence Engine service was unable to connect to the SIP listener interface | Error |
| PEStateLocked | Cisco Presence Engine service is administratively prohibited from processing traffic | Error |
| PEStateDisabled | Cisco Presence Engine service is inoperable and unable to process traffic | Error |
| PEWebDAVInitializationFailure | Cisco Presence Engine service attempt to init the WebDAV library failed | Error |
| ESPStopped | Cisco SIP Proxy service child process has been stopped | Error |
| ESPSharedMemCreateFailed | Failed to create shared memory | Error |
| ESPSharedMemSetPermFailed | Failed to set permissions on shared memory | Error |
| ESPSharedMemAllocFailed | Failed to allocate shared memory | Error |
| ESPConfigError | Cisco SIP Proxy service configuration file error | Error |
| ESPConfigNotFound | Cisco SIP Proxy service configuration file not found | Error |
| ESPCreateLockFailed | Failed to create a lock file | Error |
| ESPSocketError | Network socket errors encountered | Error |
| ESPStatsLogFileOpenFailed | Failed to open stats log file | Error |
| ESPMallocFailure | Failed to allocate memory | Error |
| ESPWrongIPAddress | Wrong IP address provided | Error |
| ESPWrongHostName | Wrong host name | Error |
| ESPPassedParamInvalid | Invalid parameter specified | Error |
| ESPNAPTRInvalidRecord | NAPTR record format error | Error |
| ESPVirtualProxyError | Virtual_Proxy_Domain related error. | Error |
| ESPRegistryError | SIP Registry failure | Error |
| ESPRoutingError | SIP route interface error | Error |
| ESPLoginError | Login datastore error | Error |
| UASCBFindFailed | SCB find failure | Error |
| UASCBGetFailed | SCB get or create failure | Error |
| CTIGWModuleNotEnabled | Cisco CTI Gateway application module is either not configured or enabled | Error |
| CTIGWProviderDown | CTI provider is down | Error |
| CTIGWUserNotLicenced | User has no license | Error |
| CTIGWUserNotAuthorized | User not authorized by CTI Gateway | Error |
| CTIGWProviderFailedToOpen | CTI Provider failed to open | Error |
| CTIGWQBEFailedRequest | QBE Request failure | Error |
| CTIGWSystemError | Cisco CTI Gateway application system errors | Error |
| PWSSCBFindFailed | SCB find failure | Error |
| PWSSCBInitFailed | SCB init failure | Error |
| PWSAboveCPULimit | Indicates the Presence Web Service has exceeded a CPU utilization threshold | Error |
| PWSRequestLimitReached | Proxy service request per second limit reached | Error |
| PWSAboveSipSubscriptionLimit | Indicates the Presence Web Service subscription count has exceeded the maximum limit | Error |
| SyncAgentAXLConnectionFailed | Cisco Sync Agent service failed authentication | Error |
| NotInCucmServerListError | Cisco Sync Agent failed to start up due to Cisco Unified CM IM and Presence Server node not being in the server list on the Cisco Unified Communications Manager publisher. | Error |
| XcpTxtConfDBConnectError | Cisco XCP data access layer was unable to connect to the DB. | Error |
| XcpDBConnectError | Cisco XCP data access layer was unable to connect to the DB. | Error |
| XcpMessArchDBConnectError | Cisco XCP data access layer was unable to connect to the DB. | Error |
| XcpMFTDBConnectError | Cisco XCP data access layer was unable to connect to the DB. | Error |
| XcpTxtConfDBFullError | Cisco XCP data access layer was unable to insert data into the DB due to insufficient disk space / tablespace. | Error |
| XcpMessArchDBFullError | Cisco XCP data access layer was unable to insert data into the DB due to insufficient disk space / tablespace. | Error |
| XcpMFTDBFullError | Cisco XCP data access layer was unable to insert data into the DB due to insufficient disk space / tablespace. | Error |
| XcpCmComponentConnectError | The XCP component failed to connect to the XCP Router. The component is shutting down. | Error |
| XcpWebCmComponentConnectError | The XCP component failed to connect to the XCP Router. The component is shutting down. | Error |
| XcpSIPFedCmComponentConnectError | The XCP component failed to connect to the XCP Router. The component is shutting down. | Error |
| XcpXMPPFedCmComponentConnectError | The XCP component failed to connect to the XCP Router. The component is shutting down. | Error |
| XcpTxtConfComponentConfigError | The XCP component detected a bad configuration. | Error |
| XcpMdnsStartError | The XCP Router failed to startup the MDNS. | Error |
| XcpComponentWriteAlarmYellow | One of XCP Router's IO components reported increased number of packets (over 50K). | Error |
| XcpComponentWriteAlarmOrange | One of XCP Router's IO components reported increased number of packets (over 80K). Packet drop may occur soon! | Error |
| XcpComponentWriteAlarmRed | One of XCP Router's IO components reported increased number of packets (over 100K). Packet dropping in effect now! | Error |
| XcpCmPauseSockets | The XCP Router has directed the XCP Connection Manager (CM) to pause listening on its socket due to load on the system. | Error |
| XcpWebCmPauseSockets | The XCP Router has directed the XCP Web Connection Manager (CM) to pause listening on its socket due to load on the system. | Error |
| XcpCmPauseSockets | The XCP Router has directed the XCP Connection Manager (CM) to pause listening on its socket due to load on the system. | Error |
| XcpSIPFedCmPauseSockets | The XCP Router has directed the XCP SIP Federation Connection Manager (CM) to pause listening on its socket due to load on the system. | Error |
| XcpXMPPFedCmPauseSockets | The XCP Router has directed the XCP XMPP Federation Connection Manager (CM) to pause listening on its socket due to load on the system. | Error |
| XcpCmStartupError | The XCP Connection Manager service failed to startup. | Error |
| XcpWebCmStartupError | The XCP Web Connection Manager service failed to startup. | Error |
| XcpSIPFedCmStartupError | The XCP SIP Federation Connection Manager service failed to startup. | Error |
| XcpXMPPFedCmStartupError | The XCP XMPP Federation Connection Manager service failed to startup. | Error |
| XcpWebCmHttpdError | The XCP Web Connection Manager service has errors in the HTTP interface. | Error |
| XcpCmXmppdError | The XCP Connection Manager service has errors in the XMPP interface. | Error |
| XcpCmConnectionsPerIpLimit | The number of accepted incoming XMPP client connections per IP address has reached the maximum limit specified by the configuration. | Error |
| XcpWebCmConnectionsPerIpLimit | The number of accepted incoming web (BOSH) client connections per IP address has reached the maximum limit specified by the configuration. | Error |
| XcpCmReadBytesLimit | The number of bytes read from single client connection has reached the maximum limit specified by the configuration. | Error |
| XcpWebCmReadBytesLimit | The number of bytes read from single client connection has reached the maximum limit specified by the configuration. | Error |
| XcpTxtConfGearError | The XCP Text Conference Manager Service failed to load a configured gear. | Error |
| XcpTxtConfDbQueueSizeLimitError | The number of DB requests has reached the maximum limit specified by the configuration. | Error |
| XcpTxtConfTCMessagesMsgIdError | Invalid state of table tc_messages in the external database used for persistent chat. | Error |
| XcpSIPGWStackResourceError | The number of concurrent S2S SIP Federation subscriptions or call-legs has reached the maximum limit specified by the configuration. | Error |
| XcpThirdPartyComplianceConnectError | Cisco XCP Router is unable to connect to Third Party Compliance Server | Error |
| XCPConfigMgrJabberRestartRequired | Cisco XCP Config Manager has regenerated JabberXML files after system halt due to buffer size. The XCP Router must now be restarted to pick up changes. | Error |
| XCPConfigMgrConfigurationFailure | Cisco XCP Config Manager unable to send configuration to a component. Please check logs. | Error |
| XCPConfigMgrHostNameResolutionFailed | XCP Config manager hostname resolution failed | Error |
| XCPConfigMgrR2RPasswordEncryptionFailed | XCP Config Manager Password Encryption Failed | Error |
| XCPConfigMgrR2RRequestTimedOut | XCP Config Manager R2R Configuration Request Timed Out | Error |
| XcpMFTExtFsMountError | Cisco XCP File Transfer Manager has lost its connection to the external file server. | Warning |
| XcpMFTExtFsFreeSpaceWarn | Cisco XCP File Transfer Manager has detected that the available disk space on the external file server is low. | Warning |
| SRMFailover | Cisco SRM is performing an automatic failover | Warning |
| SRMFailed | Cisco Server Recovery Manager is in the failed state | Warning |
| ReplicationIMAddressSchemeChangeFailure | This alert occurs when a IM Address Scheme change fails. | Warning |
| ReplicationDefaultIMDomainChangeFailure | This alert occurs when a local default IM domain change fails. | Warning |
| DuplicateUserid | Cisco IM and Presence Data Monitor has detected that two or more user's on the system share the same UserID value. | Warning |
| DuplicateDirectoryURI | Cisco IM and Presence Data Monitor has detected that two or more user's on the system share the same Directory URI value. | Warning |
| InvalidDirectoryURI | Cisco IM and Presence Data Monitor has detected that one or more users have an invalid Directory URI value. | Warning |
| JSMSessionsExceedsThreshold | This alert occurs when the number of JSM sessions exceeds the configured threshold for maximum session defined by the OVA template. Please refer the IM and Presence Configuration and Administration guide - Device Capacity Monitoring section for more details on maximum session limit defined per OVA template. | Warning |
| NoConnectionToPeer | This alert occurs when the NoConnectionToPeer event is generated. This indicates that a connection to a peer server is lost. | Warning |
| AutoFailoverSucceeded | This alert occurs when the AutoFailoverSucceeded event is generated. This indicates that an automted failover was executed successfully. | Warning |
| AutoFailoverFailed | This alert occurs when the AutoFailoverFailed event is generated. This indicates that an automated failover was attempted unsuccessfully. | Warning |
| AutoFailbackSucceeded | This alert occurs when the AutoFailbackSucceeded event is generated. This indicates that an automated failback was executed successfully. | Warning |
| AutoFailbackFailed | This alert occurs when the AutoFailbackFailed event is generated. This indicates that an automated failback was automated unsuccessfully. | Warning |
| SbrFailed | This alert occurs when the SbrFailed event is generated. This indicates that an automatically invoked split-brain resolution procedure returned an error. | Warning |
| DiskConsumptionCloseToCapacityThreshold | Disk space consumption is near the disk capacity threshold defined on the System Settings > Advanced > Disk Capacity page in Cisco Unity Connection Administration. The system will not record new messages if disk consumption reaches the threshold. | Warning |
| DiskConsumptionExceedsCapacityThreshold | Disk space consumption has reached the disk capacity threshold defined on the System Settings > Advanced > Disk Capacity page in Cisco Unity Connection Administration. The system will not record new messages when disk consumption is at or higher than the threshold. | Warning |
| LicenseExpiredWarning | An insufficient license violation has continued beyond the grace period. System operation will be suspended. For details, see License Page on the Cisco Unity Connection Administration on Unity Connection and License Usage on the Enterprise License Manager Administration. Please reduce usage to match the licensed limits on Enterprise Licensing Manager or purchase additional licensed functionality. Once system is in Compliance again, manual restart of the system will be required to restore system operation. | Warning |
| LicenseViolationWarning | An insufficient license violation has occurred. For details, open the License Usage screen on the Enterprise License Manager administration web pages. If license violation continues beyond grace period, system operations will be suspended. | Warning |
| ElmNotConnected | Connectivity with Enterprise License Manager Server is broken. If connectivity is lost beyond grace period, system operations will be suspended. | Warning |
| BranchProvisioned | The branch associated with central unity connection has been successfully provisioned. | Warning |
| DbAlmostFull | The DbSpace is almost full. If the DbSpace becomes full, the system may not be able to provide all services. | Warning |
| BranchProvisioningFailed | Provisioning for a branch associated with the central unity connection has failed. | Warning |
| BranchProvisioningFailedMaxWait | The branch provisioning has failed due to max wait time reached for the provisioning completion response from the branch. | Warning |
| BranchProvisioningFailedMaxRetries | Provisioning for a branch associated with the central connection has failed in all the retries. | Warning |
| BranchNotReachable | Connectivity between central and branch office is broken. | Warning |
| CentralNotReachable | Connectivity between branch and central office is broken. | Warning |
| EvtReaderDirectoryException | Directory synchronization encountered an internal processing error. | Warning |
| EvtReaderRetryQueueGettingFull | While processing object changes, Reader failed to apply those changes and put those into Retry Queue. This queue is now getting full. | Warning |
| EvtERDisconnected | This alert occurs when the ER Disconnect alarm is raised by informix. | Warning |
| VoicenameReaderPublisherOnly | This instance of the voice name synchronization task did not run because it was started on a subscriber machine of a cluster. | Warning |
| VoicenameReaderNotFound | The synchronization task requires information about the remote location link in order to synchronize, but it could not find the information in the database. | Warning |
| VoicenameReaderException | Voice name synchronization encountered an internal processing error. | Warning |
| ReaderNotFound | The synchronization task requires information about the remote location link in order to synchronize, but it could not find the information in the database. | Warning |
| ReaderPublisherOnly | This instance of the directory synchronization task did not run because it was started on a subscribing member of a cluster. | Warning |
| ReaderNetworkLoopDetected | While processing object changes, Reader failed to apply those changes as it detected network loop. | Warning |
| ReaderDirectoryNoSMTPDomain | The SMTP domain is necessary to address and transfer messages between locations. Synchronization will not be possible until the SMTP domain is configured on the remote site / location. | Warning |
| ReaderDirectoryFeedAccessError | The intersite bridgehead/HTTP(S) location object feed contains the directory information necessary to allow addressing messages to users on remote site/locations. An error during object feed retrieval prevents full synchronization with the remote site/location. | Warning |
| ReaderInfoFeedError | The synchronization task attempts to download the status of the remote site/ location, but this status information was not available at this time. | Warning |
| NetworkRemoverFailure | The remote site link cannot be deleted because all the objects synchronized with the remote site have not been removed. | Informational |
| NetworkRemoverError | The 'Remove Objects Associated With Deleted Remote Sites' task encountered an error. This may be a result of other activity on the system. The next run of the task may not encounter the same issue. | Informational |
| EvtReaderDirectoryOverflow | The number of directory objects at this location has gone beyond the supported limit. | Informational |
| DirectorySynchronizationAlertMode | HTTP(S) location Publisher machine is currently inaccessible, although directory synchronization is being done with its subscriber machine. | Informational |
AI-based Anomaly event alert rule
Use this rule to receive AI-based alerts for UC application Services scenarios such as anomaly related to registrations drops, call volume and call failures.
How to create a rule
- Sign in to Control Hub, and go to Notifications > My rules.
- Click Create rule.
- In the Summary section, configure the UC application alerts rule.
- From the Service list, choose Calling.
- From the Type list, choose the Cloud Intelligence AI Based Anomaly Events.
- Select the preferred Severity.
- This field shows how severe or important an alert is. You can choose severity level as High, Medium, or Low.
- Refer to Severity table section to know more on Control Hub and alert type severity.
- Refer to AI Anomaly list table to know more on the different alert name, description and severity level.
- Enter a Title for the new rule and check the alerts toggle is turned ON.
- Check the alerts toggle is turned ON to receive notifications for the
alert.
When turned OFF, users won’t get alerts.
- In the Target section, select one or more Cisco Unified Call Manager application clusters to receive AI-based anomaly alerts.
- In the Rule definition section, create a rule to get notified of AI-detected
anomalies for calls and phone registration activity. Choose the events for the selected
UC application cluster that you want to monitor. The events are
- Call failures – Receive alerts for call failure anomalies detected against forecasted data, including unexpected spikes in call failures.
- Call volume – Receive alerts for call failure anomalies detected against forecasted data, including unexpected spikes in call failures. .
- Phone registration drop – Receive alerts for phone registration drop anomalies detected across clusters and device pool against forecasted data.
- In the Delivery channel section, choose how to receive the alerts:
- Email—Enter the email addresses of who'll receive the alerts.
- Webex space—Enter the name of the space to receive the alert as messages in
a space. The bot only messages recipients that are added in the email delivery
channel.
Your organization must have Messaging enabled for Webex App to use a space as a delivery channel.
- Webhook—Check this check box if you want to use the alert with third-party applications.
- Click Save.
Once the rules are created, it takes a maximum of 6 hours to start receiving the notifications.
For devices, you can create rules to get alerts for:
- Offline and online events—An event is registered after a device has been offline for 5 minutes or has come back online 5 minutes ago. You can create up to 100 of these alerts.
- Issues that are detected or resolved events—You can select if you want to receive all alerts or mute the ones that you don't wish to receive. You can create up to 100 of these alerts.
- Software version expiry—An alert is sent out 14 days and 3 days before the software version expires for the device. You can create up to 10 of these alerts
See RoomOS device alerts in Control Hub article for more details on available alerts and how to set them up for Board, Desk, and Room Series devices in your organization.
Alerts of PhoneOS Phones on Control Hub
As the administrator, you can check the status of phones that are registered to Webex Calling. If any issue occurs on the phone, you can see the details in the Issues & Information section under the Devices for diagnostics and troubleshooting.
Also, you can view all alerts that are reported by the phone in Notifications. For more information about Notifications, see Notifications in Control Hub.
Call protocol
| DisplayName | Code | Type | Message | Level |
|---|---|---|---|---|
| Limited service | wxclimitedservice | Limited service | SRST mode - this phone has limited service.
The message can also display on the phone screen. | Warning |
| Sip profile registration | SIPProfileRegistration | SIP registration failed | SIP registration failed | Error |
Network
| DisplayName | Code | Type | Message | Level |
|---|---|---|---|---|
| Packet loss detected | networkquality | Packet loss detected | During the last call we detected a level of packet loss that may have impacted the call quality. Packet loss is typically caused by network congestion. | Warning |
Action button
| DisplayName | Code | Type | Message | Level |
|---|---|---|---|---|
| Action button not configured | actionbuttonnotconfig | Action button not configured | The Action button is not configured. Configure it in All Configurations > Phone >Action Button. | Warning |
| Action button emergency service unavailable | emergencyunavailable | Action button emergency service unavailable | It's impossible to access the emergency service since no line is registered. Will fail to use the Action button or dial numbers to access the service. | Warning |
Security
| DisplayName | Code | Type | Message | Level |
|---|---|---|---|---|
| SCEP certificate enrollment failed | scepcertenrollmentfailed | SCEP certificate enrollment failed | SCEP certificate enrollment failed | Error |
Configuration
| DisplayName | Code | Type | Message | Level |
|---|---|---|---|---|
| Failed to apply configuration changes | wxcresyncfailed | Failed to apply configuration changes | The phone failed to apply configuration changes. The configurations may be out of date. | Error |
| Upgrade failed | wxcupgradefailed | Upgrade failed | The phone failed to update the firmware. Check that the device has a working network connection, that DNS is configured and it is not blocked by firewalls or proxies. | Error |
Use Agent Central notifications in Control Hub to review Agentic Apps server and capability changes that may affect access for your organization. Agent Central notifications appear when an enabled public or private Agentic Apps server changes in a way that requires administrator awareness or review.
You must be a Control Hub administrator with access to Notifications to view Agent Central alerts for Agentic Apps and manage the delivery rule for generated alerts.
In Control Hub, Agentic Apps alerts and generated rules appear with the Agent Central name. Search for Agent Central when you filter alerts or rules.
All Agent Central alerts for Agentic Apps appear in Control Hub. High severity blocked alerts can also be delivered by email or to a Webex App space when you configure delivery for the generated rule. Low severity warning alerts appear in Notifications only.
Repeated detection of the same unresolved change doesn't generate duplicate alerts. If the issue is cleared and the server changes again later, Control Hub creates a new alert for the new change.
View Agent Central alerts for Agentic Apps
You must be a Control Hub administrator with access to Notifications.
| 1 |
Sign in to Control Hub. |
| 2 |
Go to Notifications > Alerts. |
| 3 |
Select All alerts to view alerts for your organization, or My alerts to view alerts delivered to you. |
| 4 |
Use search or filters to find Agent Central alerts. |
| 5 |
Select the alert row to view alert details, or select Review server to open the affected Agentic Apps server. |
Agent Central alert types
Agent Central alerts for Agentic Apps tell you whether access can continue with a warning or is blocked until an administrator reviews the change.
| Alert type | Severity | What it means | What to do |
|---|---|---|---|
| Metadata communication warning | Low | The server name, description, or same-domain URL changed, and access can continue until review. | Review the server and re-approve the metadata, or disable the server if you don't trust the change. |
| Metadata communication blocked | High | A server-level change blocks access. This can include a new URL domain, a blocked metadata change, Agent Card security or interface changes, or an invalid server badge. | Review and re-approve the server, follow the server page guidance for badge issues, or disable the server. |
| Capability communication warning | Low | An enabled tool, prompt, resource, or skill changed, and your organization allows access to continue until review. | Review and re-approve the affected capability, or disable it. |
| Capability communication blocked | High | An enabled tool, prompt, resource, or skill changed and your organization doesn't allow access to continue, or an enabled item was removed or renamed. Access to the affected item is blocked. | Review and re-approve the affected capabilities, or disable the affected items. |
If the same refresh detects both warning and blocked capability changes, Control Hub shows one high severity blocked alert with both states listed in the alert details. For example, a blocked alert can include two tools with status Blocked and one prompt with status Warning.
Registered servers don't generate Agent Central alerts until they're approved and enabled for your organization. New tools, prompts, resources, or skills that haven't been enabled for your organization don't trigger Agent Central alerts.
Review and resolve Agent Central alerts
Use Review server from an alert to inspect the affected Agentic Apps server or capability.
| 1 |
Sign in to Control Hub. |
| 2 |
Go to Notifications > Alerts. |
| 3 |
Search for Agent Central. |
| 4 |
Open the alert that you want to review. |
| 5 |
Select Review server. |
| 6 |
Review the affected server metadata, tool, prompt, resource, or skill. |
| 7 |
Choose one of these actions:
|
Control Hub clears the active alert after the issue is corrected, disabled, or re-approved. Manually marking an Alert Center row as resolved doesn't approve metadata, restore a badge, or unblock an affected capability. If the underlying issue is still present, Control Hub may create a new alert when it detects the unresolved change again.
View Agent Central alert rules
Agent Central alert rules for Agentic Apps are automatically generated by Webex and appear under the General service. These generated rules are read-only for rule name, severity, service, and trigger conditions. For high severity blocked rules, you can configure delivery channels and recipients.
| 1 |
Sign in to Control Hub. |
| 2 |
Go to Notifications > Alerts. |
| 3 |
Select All rules. |
| 4 |
Search for Agent Central. |
Configure delivery for high severity Agent Central alerts
High severity blocked alerts can be delivered by email or to a Webex App space. Control Hub always receives the alert, even if you don't add an email or Webex App recipient.
| 1 |
Sign in to Control Hub. |
| 2 |
Go to Notifications > Alerts. |
| 3 |
Select All rules. |
| 4 |
Search for Agent Central. |
| 5 |
Open one of the high severity blocked rules: Agent Central metadata communication blocked or Agent Central capability communication blocked. |
| 6 |
In Delivery channel, select Email and add the email recipients. |
| 7 |
To deliver alerts in a Webex App space, select Webex space and choose the space delivery option. |
| 8 |
Save the rule. |
Notes and limitations for Agent Central notifications
Keep these notes and limitations in mind when you use Agent Central notifications for Agentic Apps.
- Agentic Apps alerts appear with the Agent Central name in Control Hub.
- Low severity warning alerts are Alert Center only.
- High severity blocked alerts can be delivered by email or Webex App space if delivery is configured on the generated rule.
- Registered but not enabled servers don't generate Agent Central alerts.
- New upstream capabilities that haven't been enabled for your organization don't trigger Agent Central alerts.
- Repeated detection of the same unresolved change doesn't create duplicate alerts.
- Public server alerts are scoped to each affected enabled organization.
- Private server alerts are scoped to the owning organization after the server is approved and enabled.
- When a server-level metadata issue blocks access, Control Hub may show the metadata blocked alert instead of separate capability alerts until the server-level issue is resolved.
You can set up a webhook callback URL so that alerts show up in third-party applications. The admin can specify a webhook callback URL in Control Hub. After providing a callback URL, you can select the webhook option as an additional delivery channel in the rules for new or existing alerts. See below for steps on how to configure webhooks.
Here's an example of what the JSON element for an alert webhook looks like:
{
"orgId": "1ab23cde-4567-890f-1234-gh56ijk07l891",
"title": "title",
"summary" : "notification for a test alert",
"actionUrl" : "www.actionURL.com",
"severity" : "HIGH",
"eventType" : "created",
"resourceType": "ControlHubAlerts",
"type": "Meeting",
"subtype": "Live Meeting Monitoring",
}
Set up a webhook callback URL
You must first add a webhook callback URL before you can enable rules to use webhooks.
| 1 |
Sign in to Control Hub and go to Organization Settings. |
| 2 |
Scroll to the Webhook configuration section. |
| 3 |
Toggle the Configure the webhook URL switch to on. A pop-up window appears. |
| 4 |
Enter the webhook URL that you want to use. You can also choose to add a secret token for the webhook. View this blog to learn more about secret tokens. 
|
| 5 |
Select Validate. If validation fails, check to make sure the webhook URL and secret token are correct. Click Try again once you've finished checking. |
| 6 |
Select Save. |
Enable webhook in a rule
After setting up a webhook URL, you can set up rules to use webhooks as a delivery channel.
| 1 |
Sign in to Control Hub and go to Notifications > My rules. |
| 2 |
In the All rules tab, select a rule. |
| 3 |
In the Delivery Method section, check the Webhook checkbox. Based on the type of alert you're creating, a payload example is shown so that you can know what to expect. 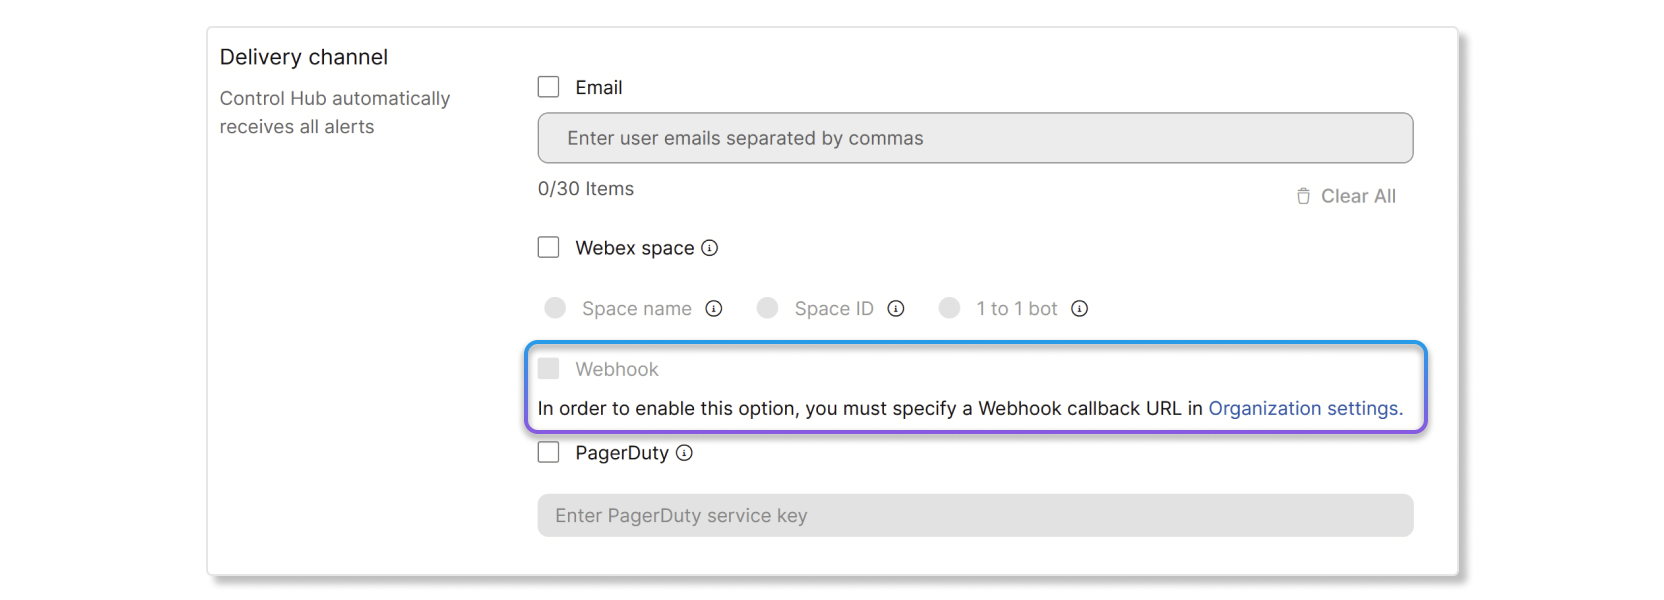
|
| 4 |
Click Save. |
Cisco devices webhook field reference
For information on webhook field references for Cisco devices, see this article.
You can set up a PagerDuty integration key so that alerts show up in third-party applications.
Enable PagerDuty in a rule
Before you begin
You must first get an integration key in PagerDuty before you can enable the PagerDuty setting for alerts in Control Hub. To get an integration key, create a new service in PagerDuty and select Events API V2 as the integration. Once you create an Events API V2 service, you can find the integration key in the Integrations tab of the PagerDuty dashboard.
| 1 |
Sign in to Control Hub and go to Notifications > My rules. |
| 2 |
In the Delivery channel section, check the PagerDuty checkbox. |
| 3 |
Enter the integration key that you created in the PagerDuty dashboard. |
| 4 |
Click Save. |


